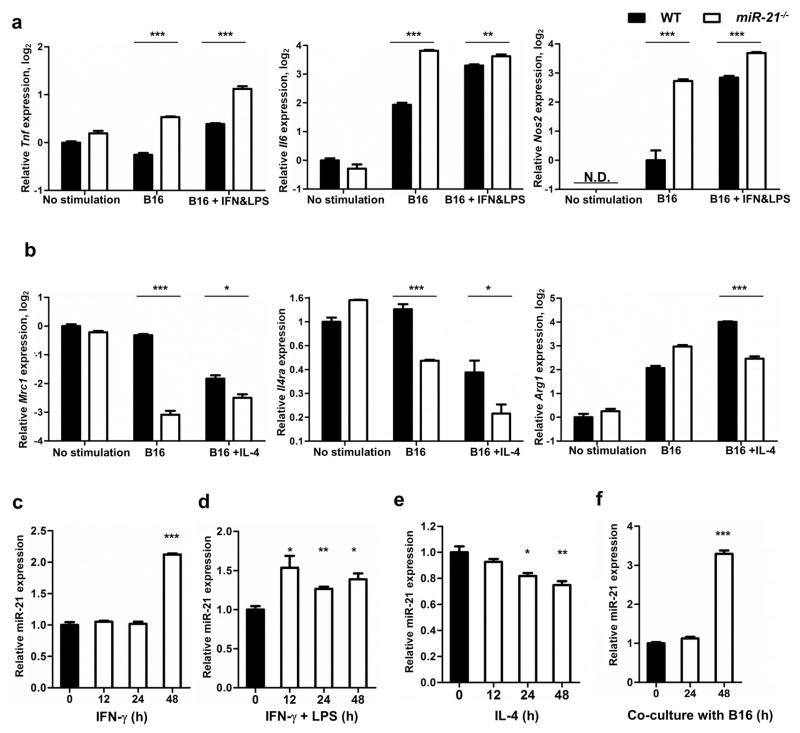
Figure 5. miR-21 in macrophages.
(a, b) qPCR measurement of (a) Tnf, Il6, and Nos2 and (b) Argc1, Mrc1, and Il4ra gene transcripts in WT and miR-21−/− bone marrow-derived macrophages at resting conditions, co-cultured with B16 cells, or co-cultured with B16 cells in addition to IFN-γ and LPS or IL-4 treatment. Y axis denotes log2 values of the relative expression levels of genes (except for Il4ra, which was the relative level of Il4ra) normalized to Gapdh. NOS2 was undetectable (N.D.) without stimulation. (c–f) Mature miR-21 was measured by qPCR in WT BMDMs upon stimulation with IFN-γ, IFN-γ and LPS, IL-4, or co-culture with B16 cells. Y axis denotes the relative expression levels of miR-21 using snoRNA-153 as a reference. Values are mean ± s.e.m.; *P ≤ 0.05, **P ≤ 0.01, ***P ≤ 0.001.

