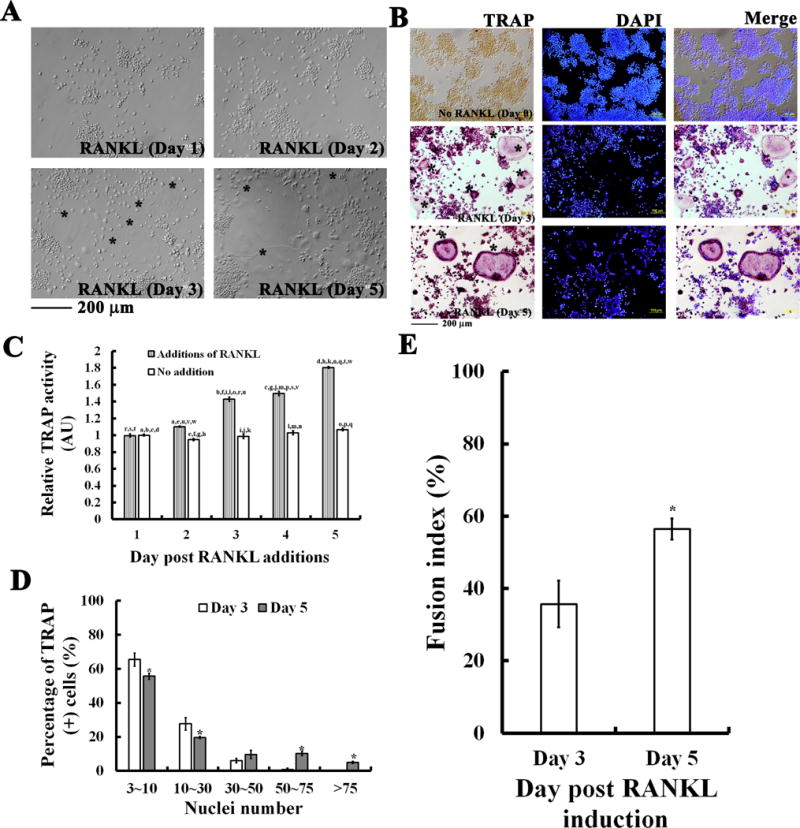
Fig. 1. RANKL-induced osteoclastogenesis.

(A) RAW264.7 cells cultured with 50 ng/ml RANKL for 1, 2, 3, and 5 days induced morphological changes to large and multinucleate osteoclast-like cells (OCs). (B) Characteristic TRAP-staining in cells with or without RANKL induction for 3 and 5 days. Multinucleate OCs (MNCs) (as labeled with *) were observed by TRAP and nuclei staining with DAPI. Calibration bar in (A) and (B) as indicated, respectively. (C) Quantitative analyses for RANKL-induced TRAP activity for days as indicated. TRAP activity was determined by measuring the secreted TRAP in the cultured medium for each day with a microplate reader at absorption wavelength of 405 nm. Quantitative analyses showing increases in (D) TRAP-positive (+) multinucleate cells (MNCs) and in (E) cell fusion index in RANKL-induced RAW264.7 cells for 3 and 5 days. Fusion index was determined by measuring the portion of clustered nuclei to total nuclei in cells by using Image-Pro Plus computerized software. In C, D, and E, the values are the mean ± SEM (n=6). In C, one-way ANOVA was used to compare the statistical difference among groups, while in D and E a Student’s t-test was used, a to w indicating a significant difference (P<0.05) between each group in C, and asterisks (*) indicating a significant difference (P<0.05) compared to the RANKL treatment for 3 days in D and E.
