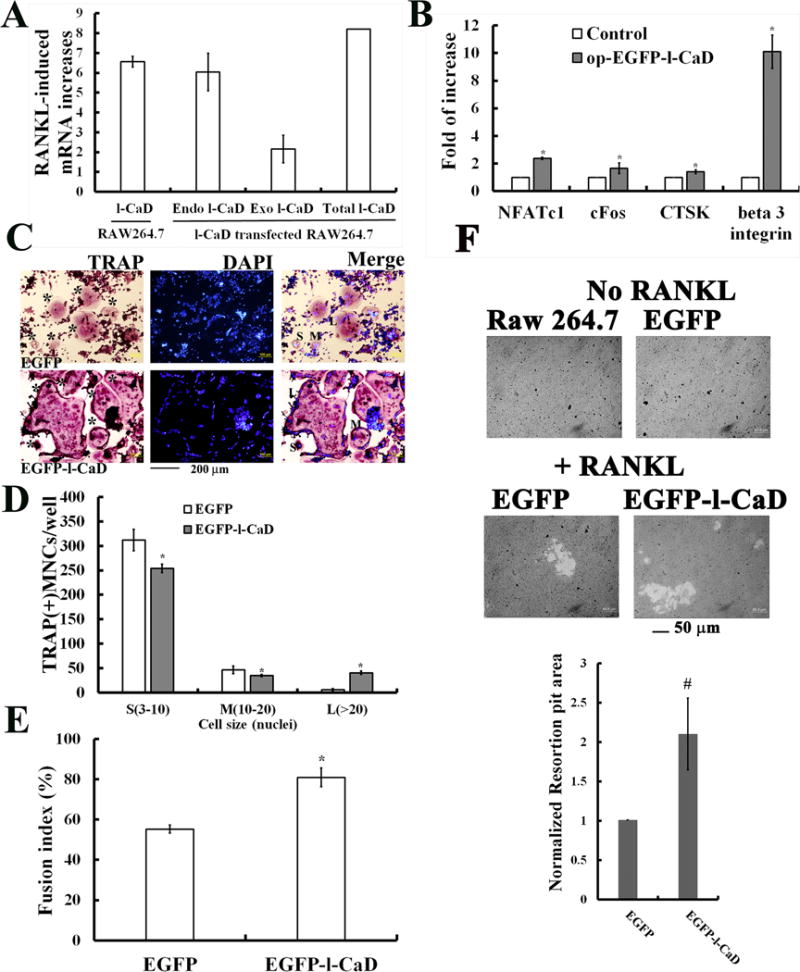
Fig. 3. Overexpression of l-CaD accelerates RANKL-induced OC cell differentiation and resorption function.

(A) Real time qPCR data analyses showing the significant increases of l-CaD in the RANKL-induced RAW264.7 cells, as well as increases of both endogenous and exogenous l-CaD (total l-CaD expression) in pEGFP-l-CaD transfected cells. (B) Real time qPCR data analyses showing the significant increases of other osteogenic genes, e.g., NFATc1, cFos, CTSK, and β3 integrin for RANKL-induced RAW264.7 cells with EGFP-l-CaD transfection (op-EGFP-l-CaD), as compared to control cells without transfection. (C) Analyses with TRAP staining, nuclei staining with DAPI, and merged images in RANKL-induced RAW264.7 cells with EGFP (top) or EGFP-l-CaD (bottom) transfection. * indicating TRAP-positive multinucleate OCs (MNCs). Labels of S, M, L indicating MNCs with nuclei number of 3-10, 10-20, and >20, respectively. Calibration bar as indicated. (D) Quantitative analyses for TRAP-positive MNCs/well in RANKL-induced RAW264.7 cells with EGFP or EGFP-l-CaD transfection. The OC cells with nuclei numbers as indicated. (E) Quantitative analyses for the cell-cell fusion index in RANKL-induced RAW264.7 cells with EGFP or EGFP-l-CaD transfection. The cell fusion index defining the portion of clustered nuclei to total nuclei was measured by TRAP or DAPI nuclear staining in (C). (E) Resorption pit assay showing the increase in resorption pit area for RANKL-induced cells with l-CaD overexpression (Top). Quantitative analyses for resorption pit area in RANKL-induced Raw264.7 cells with EGFP or EGFP-l-CaD transfection (Bottom). In A, B, D, E, and F, the values are the mean ± SEM (n=6), with * indicating a significant difference compared to cells transfected with no transfection or EGFP transfection control.
