
Fig. 6. Effects of decoy peptides on the l-CaD binding to F-actin.
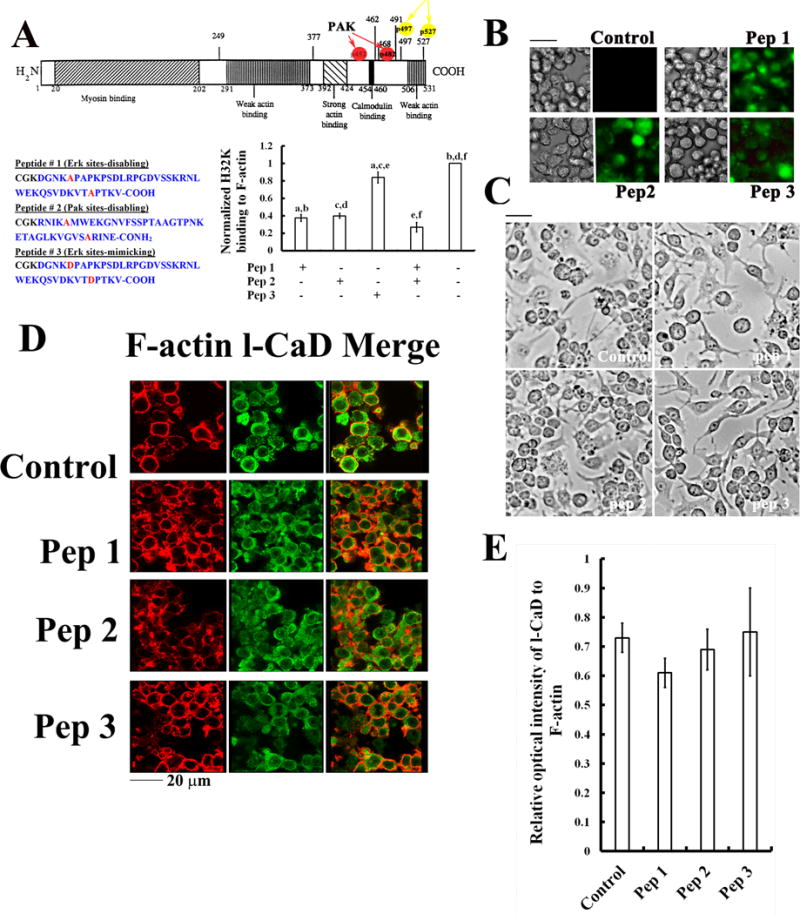
(A) Illustrated domain structures of l-CaD containing the myosin binding sites in the N-terminal domain, and the (Pak- and Erk-) phosphorylation sites in its C-terminal domain containing the Ca2+/Calmodulin site and actin-binding sites (top); the sequences for decoy peptides with Ser-to Ala mutations at the Erk-mediated (Pep1) and Pak-mediated (Pep2) phosphorylation sites of l-CaD, and a peptide (Pep3) with Ser-to-Asp mutation at the Erk-mediated phosphorylation sites to mimic phosphorylated l-CaD were shown on the bottom left panel; their competition with the C-terminal fragment of CaD (H32K) for binding to F-actin (pellet fractions in co-sedimentation assays) was shown on the bottom right panel. The values are the mean ± SEM (n=6), with a to f indicating a significant difference (P<0.05) between each group. (B) Phase contrast and fluorescence micrographs showing the efficient loading of peptides into the cells after 48 hr incubation. (C) Phase contrast micrographs showing no significant effect on morphological changes and cell growth of cells with or without loading the l-CaD decoy peptides. (D) Fluorescence micrographs showing no significant effect on the relative distribution of F-actin (red) and total l-CaD (green) and the merged images on the right for cells with or without loading the l-CaD decoy peptides. (E) Quantitative analyses of the total l-CaD/F-actin labeling fluorescence ratio in cells with or without loading the l-CaD decoy peptides. The values are the mean ± SEM (n=6). There is no significant difference among experimental groups.