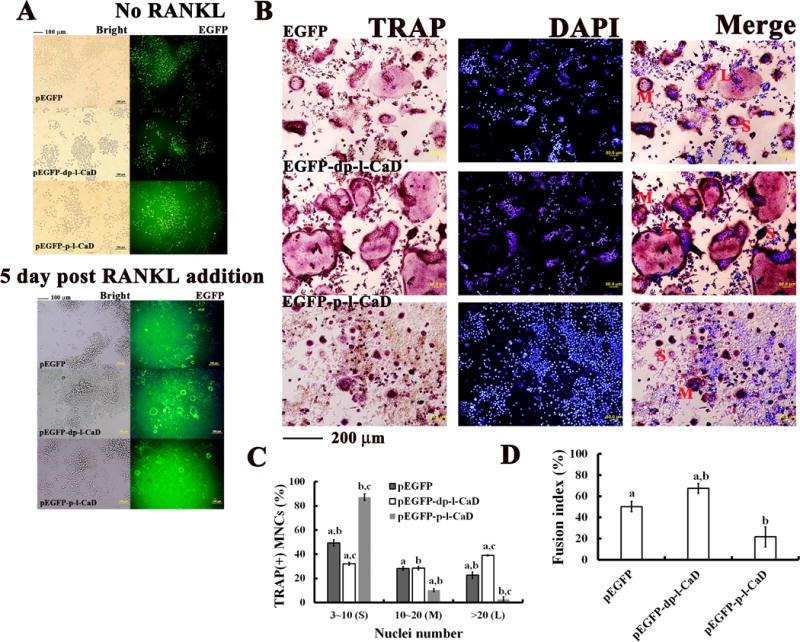
Fig. 8. Effect of phosphorylated and dephosphorylated l-CaD on RANKL-induced TRAP activity and cell-cell fusion.

(A) Phase contrast and fluorescence microscopy showing RAW264.7 cells transfected with EGFP, EGFP-phosphorylated l-CaD fusion mutant or EGFP-dephosphorylated l-CaD fusion mutant before (top) and after (bottom) RANKL induction for 5 days. (B) RANKL-induced TRAP-positive OC images with TRAP staining (red) and DAPI nuclei staing (blue) for EGFP transfection control, transfection with EGFP-dephosphorylated l-CaD fusion mutant and with EGFP-phosphorylated l-CaD fusion mutant. Red labels of S, M, L indicating MNCs with nuclei number of 3-10, 10-20, and >20, respectively. Calibration bar 100 μm in (A) and (B) as indicated. (C) Quantitative analyses for TRAP-positive multinucleate OCs (MNCs)/well, and (D) the cell fusion index in RANKL-induced RAW264.7 cells of EGFP transfection control, transfection with EGFP-dephosphorylated l-CaD fusion mutant and transfection with EGFP-phosphorylated l-CaD fusion mutant, respectively. In C and D, the values are the mean ± SEM (n=6), with a to c indicating a significant difference (P<0.05) between each group.
