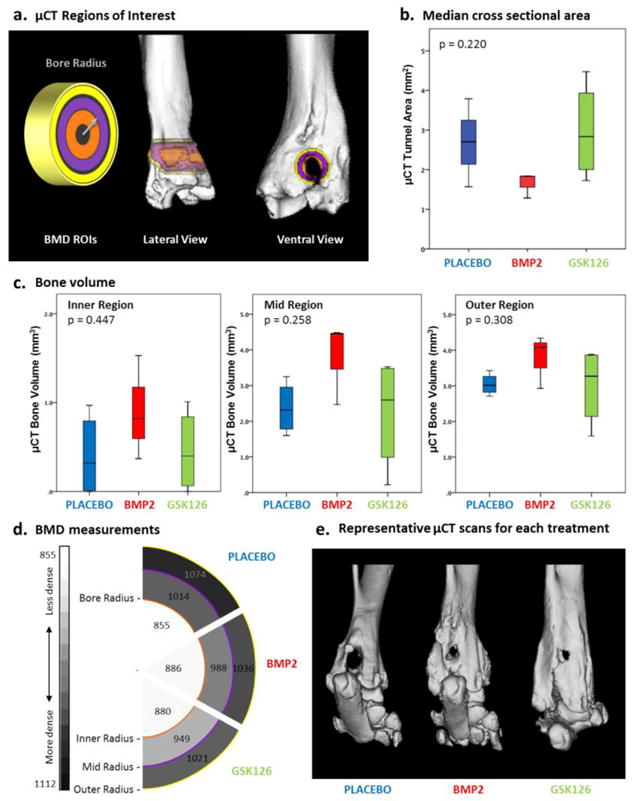
Figure 4.

μCT assessment of rat tendon-to-bone tunnel healing. (a) Schematic showing the areas (rings) used to assess bone mineral density (BMD) measurements. The (orange) inner circle has a radius equal to the radius of the bore. Lateral and ventral views of the limb are presented with the measurement areas imposed on top. (b) Box and whisker plot of the median μCT bone tunnel area measurements vs treatment. BMP2 presents the smallest bone tunnel area. (c) Bone volume quantification demonstrates a trend of increased median bone volume values, particularly in BMP2 treated animals. (d) Schematic of the bone mineral density measurements for each treatment group and ring radius, with increasing bone density represented by the darkest intensities. No significant differences in BMD were observed for treatment groups. (e) Representative μ-CT 3D reconstructions, supporting the trend of reduced cross sectional area and increased bone volume in the bone tunnel of BMP2 and GSK126 treated animals.
