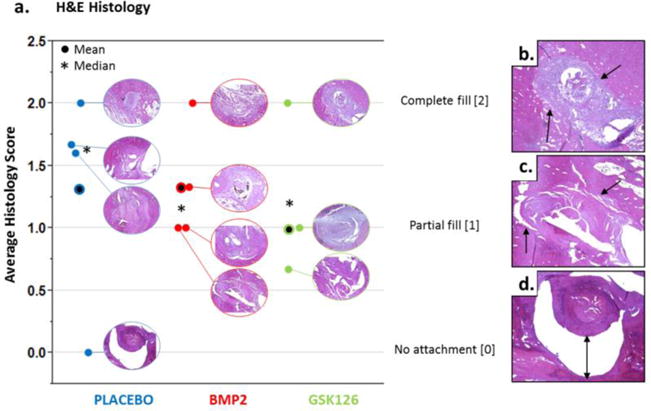
Figure 5.

Histological Assessment. (a) The bone tunnels for all histology samples are shown in the graph with the average and median histology scores (n=3 blinded readers) presented. Representative images of (b) complete fill, score of 2; (c) partial fill, score of 1; (d) no attachment, score of 0. Notably, only the placebo group was observed to have a sample with a score of 0 (no attachment).
