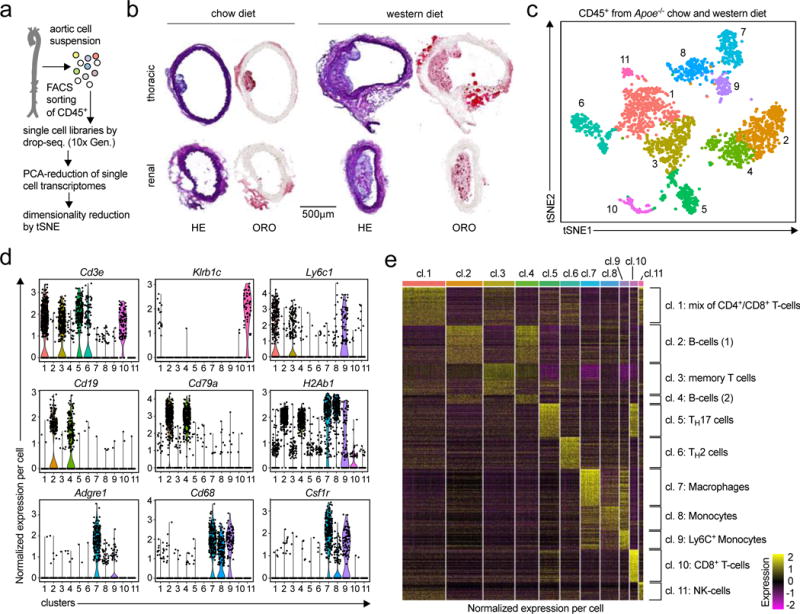
Figure 1. The single cell transcriptome identifies 11 distinct leukocyte populations in the atherosclerotic aorta.

(a) The workflow for single cell RNA-sequencing (scRNAseq) included cell isolation of aortic leukocytes, flow sorting, and drop-sequencing. (b) 8-week old, female Apoe−/− mice consumed either a chow (CD) or a western diet (WD) for 12 weeks. Cross-sections of the thoracic and renal aorta were stained with hematoxylin and eosin (H&E) to display cellularity or Oil-Red-O (ORO) to assess lipid depositions. (c) Single cell transcriptomes of aortic leukocytes from CD and WD-fed mice were analyzed with an unsupervised dimensionality reduction algorithm (SEURAT) to identify groups of cells with similar gene expression. (d) Expression of principal hematopoietic lineage markers in the eleven identified cell clusters shown as normalized gene expression per cell. (e) Top 500 differentially expressed genes among all detected aortic leukocyte clusters. Normalized single cell gene expression is shown. Retrieved clusters were assigned to known leukocyte lineages by an integrated analysis of lineage markers and the comparison to published mouse PBMC gene signatures (Online-Fig.IV). 10 aortas from Apoe−/− mice per group were included in the pool of leukocytes (c-f). Representative sections are shown in (b).
