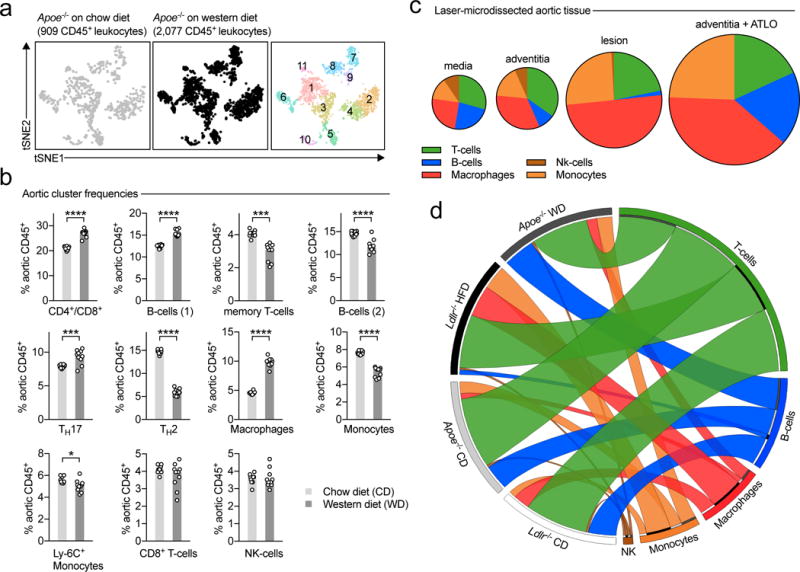
Figure 2. Spatial and numeric differences in the aortic leukocyte repertoire in atherosclerosis.

8-week old, female Apoe-deficient (Apoe−/−) mice consumed either a standard chow diet (CD) or a cholesterol-rich western diet (WD) for 12 weeks. Aortic leukocytes were isolated, subjected to scRNAseq, and distinct leukocyte clusters in CD and WD-fed mice were identified by dimensionality reduction of single cell transcriptomes. (a) tSNE plot for aortic leukocytes from CD (left) and WD (middle) consuming mice. Principal leukocyte clusters are displayed on the right graph. (b) Frequencies of the eleven clusters among all CD45+ leukocytes in both dietary interventions. (c) To characterize spatial differences of the identified leukocyte clusters, we applied a deconvolution algorithm on bulk mRNA arrays from micro-dissected tissue specimen that were obtained from female Apoe−/− mice on WD (GSE21419) and enumerated the relative frequency of the according leukocyte clusters (grouped in principal hematopoietic lineages) within the different locations. The relative proportion is shown in cake diagrams. The size of diagrams corresponds to the overall leukocyte content. (d) To compare the specific impact of the pro-atherogenic Apoe−/− background on leukocyte composition, we compared our results to scRNAseq on aortic leukocytes from healthy or atherosclerotic Ldlr−/− mice. Relative proportions of major hematopoietic lineages within the four combinations of dietary intervention and genotypes are displayed as Circos plot. Data are presented as mean±SEM. 10 aortas from Apoe−/− mice per group were included in the pool of leukocytes (b,d). Statistical significance was assessed by a two-sided, unpaired Student’s T-test on multiple iterations (b). *P<0.05, ***P<0.001, ****P<0.0001. DC: dendritic cells, ATLO: arterial tertiary lymphoid organs.
