Abstract
Survival of patients undergoing hematopoietic cell transplantation (HCT) from unrelated donors for acute leukemia exhibits considerable variation, even after stringent genetic matching. In order to improve the donor selection process, we attempted to create an algorithm to quantify the likelihood of survival to five years after unrelated donor HCT for acute leukemia, based on the clinical characteristics of the donor selected. All standard clinical variables were included in the model, which also included average leukocyte telomere length (ATL) of the donor based on its association with recipient survival in severe aplastic anemia, and links to multiple malignancies. We developed a multivariate classifier that assigned a Preferred or NotPreferred label to each prospective donor based on the survival of the recipient. In a prior analysis using a resampling method, recipients whose donors were labeled Preferred experienced clinically compelling better survival compared to donors labeled as NotPreferred by the test1. However, in a pivotal validation study in an independent cohort of 522 patients, the overall survival of the Preferred and NotPreferred donor groups was not significantly different. Although machine learning approaches have successfully modeled other biologic phenomena and led to accurate predictive models, our attempt to predict HCT outcomes after unrelated donor transplantation was not successful.
Keywords: Allogeneic hematopoietic cell transplantation, acute leukemia, machine learning, leukocyte telomere length, donor selection
Introduction
Allogeneic hematopoietic cell transplantation (HCT), ideally from a human leukocyte antigen (HLA) identical sibling, is potentially curative treatment for acute leukemia. For the majority of patients, an HLA identical sibling donor is not available, and alternative donor sources such as unrelated volunteer donors, cord blood or mismatched related donors are used2. HLA matching remains the most significant determinant of unrelated donor transplant success. While other donor selection factors such as age, sex mismatch, CMV serology, killer immunoglobulin receptor (KIR) status, and HLA-DP matching have been described as important for overall survival3, 4, 5, the prioritization and importance of these additional factors have proven challenging. In addition, the contributions of the planned transplant procedure and interactions with donor characteristics are poorly understood. Even in the presence of high resolution matching for 8/8 HLA alleles, a high degree of variation in overall survival has been observed6, 7. Various other genetic and clinical donor characteristics have been studied and used in clinical practice to select donors, but none has become the standard of care8, 9.
We report results of a clinical validation study of a novel multivariate Support Vector Machine (SVM) classifier intended to identify preferred unrelated donors for a given recipient. The classifier is a mathematical formula which accepts as input the clinical variables for the given patient/donor pair and assigns a label “Preferred” or “NotPreferred” to the pair. The concept is based on the idea that advanced modeling capabilities utilizing progress in machine learning technology may better integrate the complex information and prioritization contained in known clinical and molecular factors determining transplant outcomes than has been possible to date. The utility of this principle has been demonstrated by multiple diagnostic assays used clinically for a variety of indications, including transplantation10, 11, 12, 13. A novelty of our approach is that it uses mostly clinical covariates, as opposed to exclusively genomic data.
We hypothesized that machine learning would be able to develop an algorithm to correctly classify patients according to their five year survival status based on known patient, disease, transplant and donor characteristics, and that this algorithm would be validated on an independent cohort of patients. The goal of this work is to help a physician, using all available information, select the best unrelated donor for their patient to maximize the patient’s likelihood of survival.
The model used patient, disease and transplant characteristics that might plausibly affect survival, as judged by the clinical experts on the team. In addition, it included the length of the donor telomeres, the protective caps at chromosome ends. The telomere length was represented by the T/S Ratio (the ratio of telomere sequence and single copy gene abundances, see Materials and Methods). Donor telomere length was shown to be significantly associated with longer survival in severe aplastic anemia patients who underwent allogeneic unrelated donor HCT14. Given the similarities of the treatments, as well as its association with multiple other malignancies15, 16, 17, 18, we hypothesized that telomere length may also contribute to the classification accuracy of the donor selection algorithm.
Preliminary work had created an earlier version of the SVM classifier algorithm and it was shown to be predictive of survival using a resampling method for internal validation1. In that study, the recipients who received transplants from donors identified by the algorithm as Preferred had a statistically significant 14% absolute increase in survival at five years compared with the standard of care (represented by all patients), estimated using cross-validation. This model was subsequently tested in an independent set and showed a trend in the expected direction, but the result was not statistically significant. On the grounds of this prior work, the present study developed a new classifier algorithm using a large set of patients for training, followed by a validation study in an independent cohort.
Materials and Methods
This research was conducted using donor blood samples and donor and recipient clinical data provided by the Center for International Blood & Marrow Transplant Research (CIBMTR). The study involved 1255 patients who had received unrelated donor HCT for acute myelogenous or acute lymphoblastic leukemia between 2000 and 2010 with data reported to the CIBMTR and donor samples available through the CIBMTR Repository. The cohort was randomly partitioned into a training set (T, n = 733) and validation set (V, n = 522). All patients were 8/8 HLA-A, B, C and DRB1 high resolution matched with their donors, and all recipients underwent myeloablative conditioning and received T replete grafts (no ex vivo T-cell depletion or CD34 selection). The characteristics of the recipient/donor pairs are shown in Table 1. The telomere length assay is described in Supplementary Materials and Methods.
Table 1.
Summary of clinical variables for training and validation sets
| Variable | Training N (%) | Validation N (%) | p-value |
|---|---|---|---|
| Number of (donor, recipient) pairs | 733 | 522 | |
| Disease at transplant | 0.07 | ||
| AML | 451 (62) | 347 (66) | |
| ALL | 282 (38) | 175 (34) | |
| Recipient sex | 0.99 | ||
| Male | 386 (53) | 275 (53) | |
| Female | 347 (47) | 247 (47) | |
| Donor sex | 0.02 | ||
| Male | 475 (65) | 371 (71) | |
| Female | 258 (35) | 151 (29) | |
| Karnofsky score | 0.63 | ||
| 10–80 | 164 (22) | 126 (24) | |
| 90–100 | 509 (69) | 359 (69) | |
| Unknown | 60 ( 8) | 37 ( 7) | |
| Recipient age at transplant | 0.38 | ||
| 0–9 years | 62 ( 8) | 46 ( 9) | |
| 10–19 years | 109 (15) | 56 (11) | |
| 20–29 years | 135 (18) | 92 (18) | |
| 30–39 years | 112 (15) | 83 (16) | |
| 50–59 years | 134 (18) | 98 (19) | |
| 60 years and older | 28 ( 4) | 18 ( 3) | |
| Median (range) | 35 (1–67) | 38 (0–68) | |
| Donor age at donation | 0.90 | ||
| 10–19 years old | 16 ( 2) | 11 ( 2) | |
| 20–29 years old | 268 (37) | 194 (37) | |
| 30–39 years old | 253 (35) | 183 (35) | |
| 40–49 years old | 158 (22) | 102 (20) | |
| 50 years and older | 38 ( 5) | 32 ( 6) | |
| Median (range) | 33 (19–60) | 33 (18–61) | |
| Year of transplant | <0.001 | ||
| 2000 | 29 ( 4) | 25 ( 5) | |
| 2001 | 23 ( 3) | 27 ( 5) | |
| 2002 | 33 ( 5) | 35 ( 7) | |
| 2003 | 45 ( 6) | 40 ( 8) | |
| 2004 | 78 (11) | 45 ( 9) | |
| 2005 | 119 (16) | 61 (12) | |
| 2006 | 135 (18) | 72 (14) | |
| 2007 | 135 (18) | 71 (14) | |
| 2008 | 129 (18) | 54 (10) | |
| 2009 | 7 ( 1) | 72 (14) | |
| 2010 | 0 ( 0) | 20 ( 4) | |
| Campath given | 0.86 | ||
| Yes | 20 ( 3) | 13 ( 2) | |
| No | 708 (97) | 504 (97) | |
| Unknown | 5 ( 1) | 5 ( 1) | |
| ATG given | 0.85 | ||
| Yes | 147 (20) | 107 (20) | |
| No | 586 (80) | 415 (80) | |
| Graft type | 0.16 | ||
| PBSC | 423 (58) | 322 (62) | |
| BM | 310 (42) | 200 (38) | |
| Disease status | 0.003 | ||
| Early | 413 (56) | 337 (65) | |
| Intermediate | 320 (44) | 185 (35) | |
| Conditioning | 0.43 | ||
| TBI | 434 (60) | 298 (58) | |
| No TBI | 292 (40) | 220 (42) | |
| Donor race / ethnicity | 0.17 | ||
| Caucasian, non-Hispanic | 621 (85) | 458 (88) | |
| African-American, non-Hispanic | 7 (1) | 11 (2) | |
| Asian, non-Hispanic | 12 (2) | 6 (1) | |
| Native American, non-Hispanic | 9 ( 1) | 9 (2) | |
| Hispanic, Caucasian | 12 ( 2) | 8 (2) | |
| Hispanic, race unknown | 25 ( 3) | 11 (2) | |
| Other or unknown | 47 ( 6) | 19 (4) | |
| Recipient race / ethnicity | 0.66 | ||
| Caucasian, non-Hispanic | 639 (87) | 464 (89) | |
| African-American, non-Hispanic | 10 ( 1) | 11 (2) | |
| Asian, non-Hispanic | 12 ( 2) | 4 (1) | |
| Native American, non-Hispanic | 1 (<1) | 2 (<1) | |
| Hispanic, Caucasian | 43 (6) | 25 (5) | |
| Hispanic, race unknown | 4 ( 1) | 1 (<1) | |
| Other or unknown | 24 ( 3) | 15 ( 3) | |
| Donor T/S Ratio | 0.49 | ||
| Unknown | 2 (<1) | 0 (<1) | |
| 1.0–1.1 | 154 (21) | 135 (26) | |
| 1.1–1.2 | 98 (13) | 83 (16) | |
| 1.2–1.3 | 69 ( 9) | 44 ( 8) | |
| 1.3–1.4 | 44 ( 6) | 26 ( 5) | |
| 1.4–1.5 | 28 ( 4) | 15 ( 3) | |
| 1.5–2 | 30 ( 4) | 24 ( 5) | |
| >2 | 4 ( 1) | 3 (10) | |
| Donor height | 0.07 | ||
| Unknown | 88 (12) | 82 (16) | |
| 100–160 | 36 (5) | 23 ( 4) | |
| 160–170 | 147 (20) | 88 (17) | |
| 170–180 | 222 (30) | 150 (29) | |
| 180–190 | 192 (26) | 153 (29) | |
| >190 | 48 (7) | 20 ( 4) | |
| Donor weight | <0.001 | ||
| Unknown | 2 (<1) | 82 (16) | |
| 25–50 | 10 (1) | 2 (<1) | |
| 50–60 | 59 (8) | 26 ( 5) | |
| 60–70 | 97 (13) | 52 (10) | |
| 70–80 | 140 (19) | 93 (18) | |
| 80–90 | 150 (20) | 111 (21) | |
| 90–100 | 142 (19) | 0 (<1) | |
| >100 | 133 (18) | 70 (13) | |
| Recipient ABO blood type | 0.82 | ||
| Unknown | 8 (1) | 3 ( 1) | |
| A Rh+ | 253 (35) | 174 (33) | |
| B Rh+ | 72 (10) | 46 ( 9) | |
| AB Rh+ | 23 (3) | 14 ( 3) | |
| O Rh+ | 267 (36) | 204 (39) | |
| A Rh− | 42 (6) | 28 ( 5) | |
| B Rh− | 14 (2) | 7 ( 1) | |
| AB Rh− | 7 (1) | 3 ( 1) | |
| O Rh− | 47 ( 6) | 42 (8) | |
| GvHD prophylaxis | 0.32 | ||
| Tacrolimus+MMF+others | 70 (10) | 68 (13) | |
| Tacrolimus+MTX+others ex. MMF | 386 (53) | 270 (52) | |
| Tacrolimus+others ex. MTX, MMF | 32 ( 4) | 17 ( 3) | |
| Tacrolimus alone | 17 ( 2) | 6 ( 1) | |
| CSA+MMF+others | 15 ( 2) | 12 ( 2) | |
| CSA+MTX+others ex. Tacrolimus, | 191 (26) | 132 (25) | |
| MMF | |||
| CSA+others ex. Tacrolimus, MTX, | 8 ( 1) | 8 ( 2) | |
| MMF | |||
| CSA alone | 11 ( 2) | 8 ( 2) | |
| other | 3 (<1) | 0 (<1) |
Model creation
The principal method described in this paper converts the problem of donor selection to a machine learning binary classification problem, where the two categories were “overall survival more than five years” and “death before five years”. This approach requires exact knowledge as to whether a patient survived to five years following transplantation. For that reason, subjects who were censored prior to five years were removed from the training phase of the algorithm, resulting in 660 samples used in training.
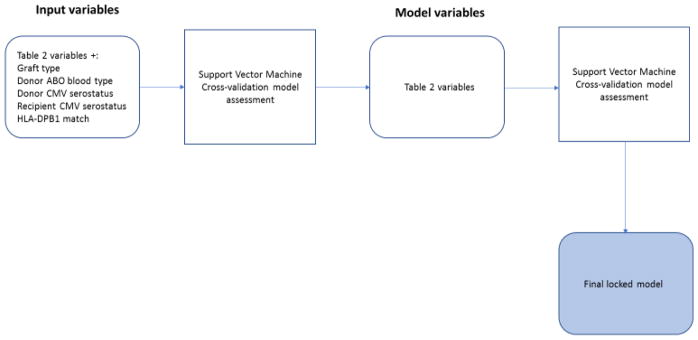
Using machine learning techniques, a preliminary analysis removed from consideration the stem cell source (bone marrow or peripheral blood), donor ABO blood type, donor and recipient cytomegalovirus serostatus, and HLA-DPB1 match. Subsequently, a structured model was created by considering all patients in the training set along with their matrix of included variables (Table 2) and their primary outcomes. The resulting multivariate training set contained 660 samples (287 who survived and 373 who did not). The SVM classifier was trained by a machine learning algorithm to accurately predict which patients survived over five years, using the knowledge of these attributes and the outcomes. The result of the training is a classifier which assigns to each new, previously unseen (patient, donor) pair a binary label of “long-surviving” or “short-surviving”. In the rest of the manuscript, the donors whose recipients were long-surviving are also referred to as “Preferred”, with the understanding that such label applies to a donor in relation to a given patient, not in isolation. The process is illustrated in Fig. 1.
Table 2.
List of variables used in the model.
| Recipient ABO blood type |
| Recipient age |
| Disease stage |
| ATG (given/not given) |
| Campath (given/not given) |
| Donor height |
| Disease (ALL/AML) |
| Donor age |
| Donor ethnicity |
| Donor sex |
| Donor weight |
| Recipient ethnicity |
| GvHD prophylaxis |
| Karnofsky performance status |
| Recipient race |
| Recipient sex |
| TBI usage indicator |
| T/S_Ratio |
Figure 1.
The process used to define the set of variables and the model used for validation.
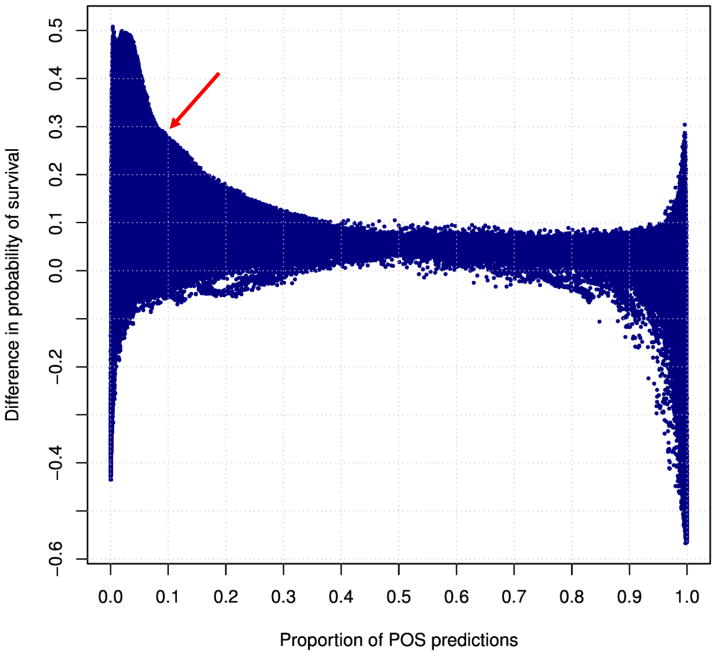
The details of model development are given in the Supplementary Materials. A key tool used to select the best model is illustrated in Fig. 2, which shows relevant performance characteristics of a large collection of classifiers, and allowed identification of a candidate algorithm for validation.
Figure 2.
A graph of relevant statistics for a large collection of SVM classifiers developed for the HCT donor selection application. Each dot represents a classifier, which labels donors as Preferred (or, equivalently, “POS”, for Positive) and NotPreferred (or, equivalently, “NEG”, for Negative). The x-axis is the proportion of donors labeled Preferred (i.e., “POS”) by the classifier. The y-axis is the survival benefit (difference in survival at 5 years) conferred by the donors, compared with survival of recipients who received HCT from NotPreferred donors. A clinically attractive classifier, selected for the validation, is labeled by red arrow. It is defined as the classifier which maximizes clinical benefit while labeling at least 10% of donors as Preferred.
Model Assessment
Once the parameters of the model were set, any given future (recipient, donor) pair could be classified as Preferred or NotPreferred by comparing their score, based on their individual variables, with the pre-specified threshold value incorporated in the model. The primary validation acceptance criterion was set as statistically significantly superior five-year overall survival of recipients corresponding to Preferred (recipient, donor) pairs compared with NotPreferred, at 0.05 significance.
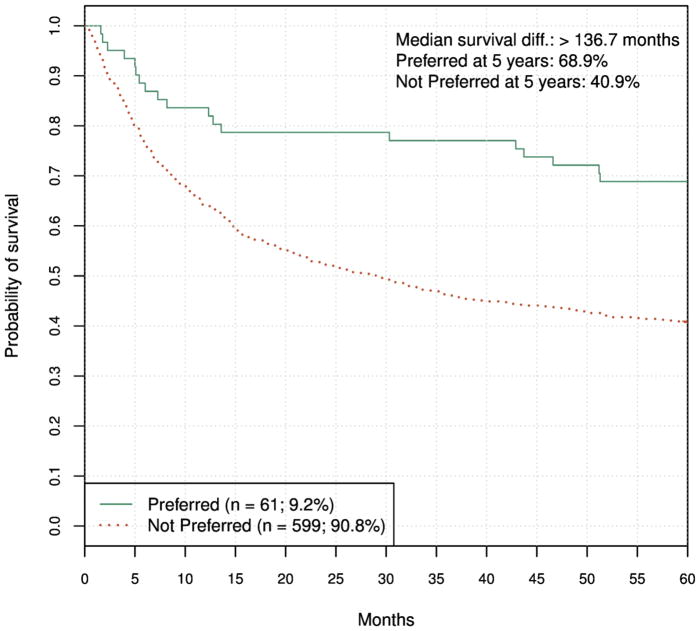
To further characterize the performance of the best classifiers, we plotted Kaplan-Meier graphs of five-year survival of training set patients that received HCT from a Preferred donor vs. the survival of patients who received HCT from NotPreferred donors. The graphs were produced using cross-validation analysis. A representative graph is shown in Fig. 3.
Figure 3.
Survival of recipients of donors labeled Preferred and NotPreferred. The graph was produced using ten-fold cross- validation. HR = 0.43 (95% CI, 0.28 to 0.67), log-rank P < 0.001.
Exploratory model
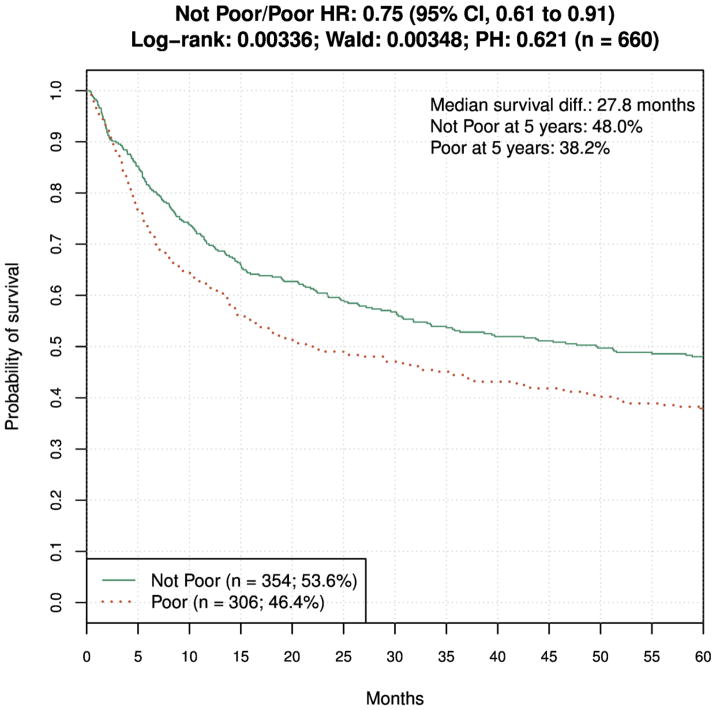
We developed another SVM model, inspired by insights from model selection graphs and clinical considerations. It utilized a different trade-off between proportion of Preferred donors and overall survival benefit, and served hypothesis-generating purpose. Because it was not the primary model, and no acceptance criteria were defined for it, we termed it “Exploratory Model”. It used the same training data and model development approach as the primary model. We used the names “Poor” and “NotPoor” for the two populations defined by this model, to better reflect the fact that this model provides for elimination of unsuitable donors, as opposed to the principal model, which identifies best donors. The selected classifier labeled about 50% of donors "Poor", defined as those who conferred less than 10% survival gain compared with the other donors. The 10% threshold corresponds to a single HLA mismatch survival difference6, which is in practice accepted as clinically meaningful improvement. Thus, this classifier identifies a higher proportion of donors as poor but defines treatment failure as a lower chance of survival rather than actual survival (Fig. 4). The clinical rationale for considering this model was the fact that it provides clinically useful information (i.e., Poor/NotPoor designation) for about 50% of donors, in contrast to the primary model that identifies only about 10% of donors as Preferred (albeit with a high predicted survival benefit).
Figure 4.
Survival of recipients of donors labeled Poor and NotPoor by the less stringent model, in ten-fold cross-validation. HR = 0.75 (95% CI, 0.61 to 0.91), log-rank P = 0.003.
Model Validation
Both the principal classifier model and the exploratory model were selected and locked before any validation data was received. This means that entire algorithm and corresponding computer code - encompassing reading of input clinical and telomere data, pre-processing, normalizing and producing Preferred/NotPreferred, and Poor/NotPoor donor labels - was recorded, documented and never subsequently changed. Per the pre-specified analytic plan, results are shown as KM graphs comparing survival of recipients identified as receiving Preferred vs. NotPreferred and Poor vs. NotPoor donors. We also report hazard ratios and corresponding log-rank test p-values. The survival difference is reported at five years after HCT.
Results
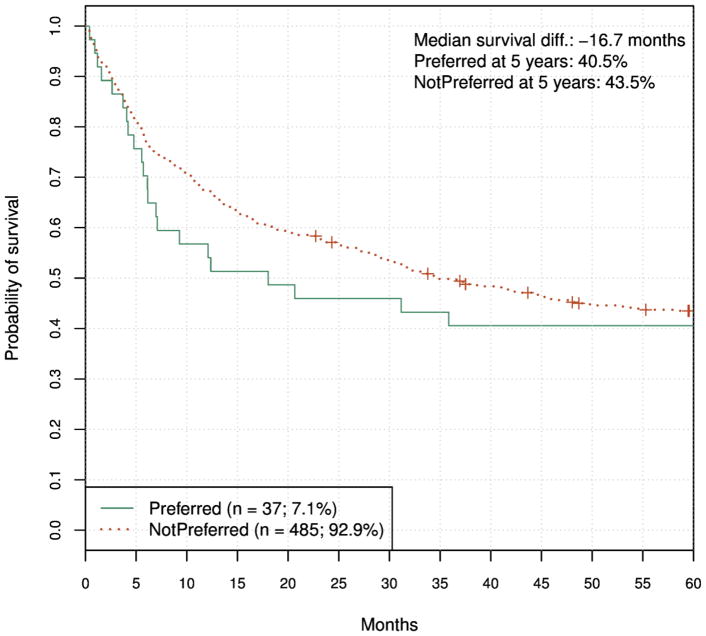
We applied the primary classification model to the validation set and obtained a Preferred or NotPreferred label for each (patient, donor) pair. The principal validation result, Fig. 5, shows Kaplan-Meier estimates of survival for the two groups. As seen, the curves trend in the opposite direction of expected, since the Preferred donors were associated with shorter survival, although this was not statistically significant.
Figure 5.
Validation KM graph for the primary classification model. HR = 1.12 (95% CI, 0.72 to 1.72), log-rank P = 0.62.
We next wanted to check if observed differences in clinical covariates between training and validation sets contributed to or caused this result. As shown in Table 1, disease, disease status, donor sex, weight and height were significantly or near-significantly different between the two sets (we ignored the differences between year of transplant because a clinical assay has to be robust with respect to them). To assess the impact of these differences, we sampled 450 (patient, donor) pairs out of the validation set such that the resulting set has non-significant difference compared with the training (with the exception of donor weight, which proved practically impossible to match). Subsequently we applied the primary classification model to the 450-set and obtained virtually identical result (HR = 1.12, 95% CI, 0.70–1.82) as in the full set. Our algorithmic approach, involving classification of (patient, donor) pairs into two survival categories based on five-year survival, required removal of training set patients who were censored prior to the cutoff time. This could potentially introduce a non-random bias in the results since the validation set did not have such observations removed. To assess the impact of this discrepancy, we analyzed results in a subset of the validation set whereby the patients censored prior to five years were removed, as was done in the training set. We found that the result (HR = 1.08, 95% CI, 0.70–1.67) was very similar as in the full set.
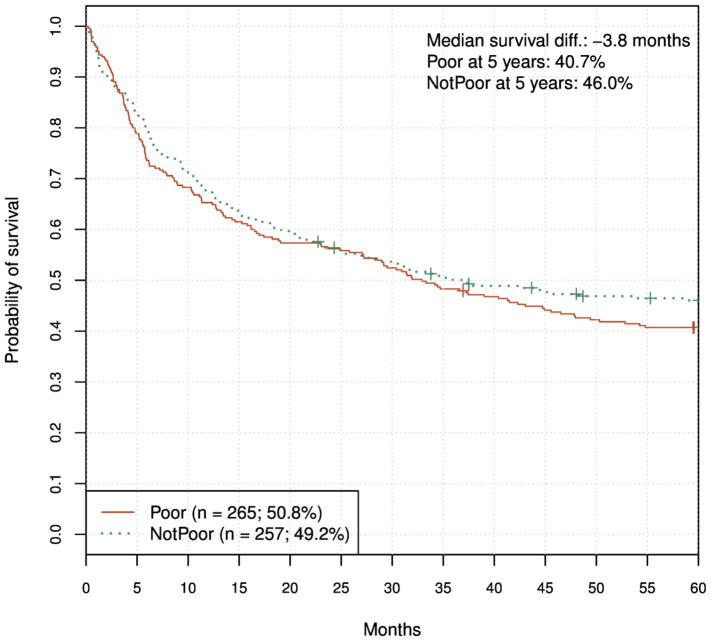
Next, we applied the exploratory model (Poor/Not Poor) to the validation set and obtained the result shown in Fig. 6. In this case the curves trend in the correct direction, however the five-year survival benefit is relatively small and not statistically significant.
Figure 6.
Exploratory model validation results at five years. HR = 1.18 (95% CI, 0.94 to 1.48), log-rank P = 0.148.
Disease-specific analysis
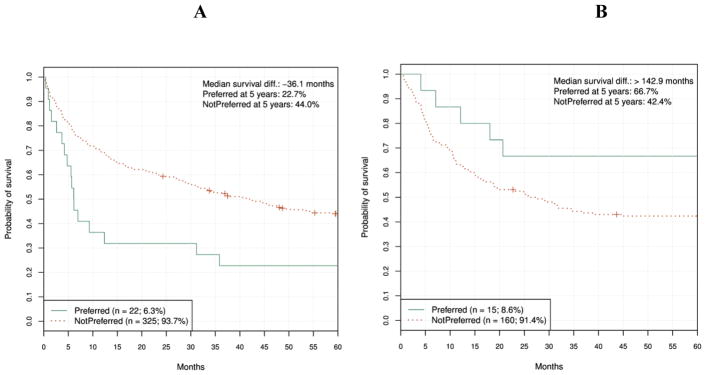
We applied the primary classification model to Acute Myeloid Leukemia (AML) and ALL sub-populations separately (Figs. 7A and 7B) as well as to other patient subpopulations to try to understand why validation failed in the independent cohort. Surprisingly, the graphs show clearly and dramatically diverging trends for the two diseases: statistical significance in the correct direction for ALL patients, and statistical significance in the reverse direction for the AML patients.
Figure 7A and 7B.
Primary classification model validation results for AML and ALL patients, respectively. AML HR = 2.01 (95% CI, 1.22 to 3.3), log-rank P = 0.005. ALL HR = 0.42 (95% CI, 0.17 to 1.02), log-rank P = 0.049.
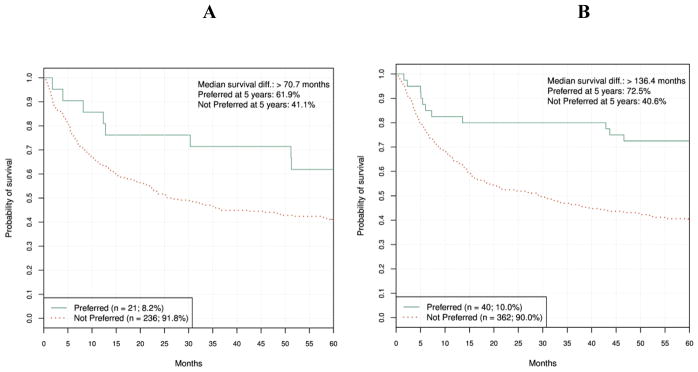
Even though the disease-specific analyses were not part of the pre-defined validation plan, we were wondering if the ALL finding could form the basis of a future, ALL-specific clinical assay. To that end, it was important to understand the robustness of this result. To provide evidence in that regard, we examined if disease-specific performance of the primary classification model in the training set. Therefore, we applied the primary model to AML and ALL patients separately, in the training (cross-validation) mode. The results are shown in Figs. 8A and 8B and demonstrate that the discrepancy between outcomes for AML and ALL patients was not present in the training set, suggesting the ALL validation result was not robust.
Figure 8A and 8B.
Primary classification model training (cross-validation) results for AML and ALL patients, respectively. AML HR = 0.56 (95% CI, 0.28 to 1.09), log-rank P = 0.083. ALL HR = 0.37 (95% CI, 0.21 to 0.66), log-rank P < 0.001.
Discussion
We attempted to develop a clinically relevant algorithm for identifying preferred unrelated donors for a given HCT recipient using all available data, including a measure of donor telomere length. The principal candidate classifier failed twice when applied to an independent validation set, according to pre-specified acceptance criteria.
We should note that the first independent validation of the model trended in the expected direction, but the survival benefit was not statistically significant (P = 0.09, unpublished data). This result suggested that the model has clinical potential and may achieve significance in a second validation on a larger set. However, the final results, presented in this article, proved otherwise.
Although the power of machine learning is its ability to aggregate complex data into meaningful patterns to predict future outcomes, the complexity of unrelated donor transplantation, combined with the lack of detailed clinical data may have proven an insurmountable challenge. The outcome of the model, survival to 5 years after HCT, is influenced by many factors that likely lose their correlation with baseline factors over time. It is also possible that we did not have access to the true determinants of patient outcome such as subtle differences in clinical care, or it may simply not be possible to create a robust model for long-term survival after HCT based solely on information available prior to the transplant.
Although the primary classifier model appeared to fit well with the training data on internal testing, it did not predict outcome in the independent validation set, and in one subset, even was associated with the opposite outcome of death before 5 years. One potential explanation is that the model was overfit for the testing set so that when applied to an independent data set, it performed worse. We also considered a hypothesis that the two cohorts were materially different, even though they were contemporaneous patients allocated to the training and testing set randomly. However, analyses of carefully matched training/validation subsets found no support for this.
In subgroup analysis, it appears that the model worked better for ALL than AML in the validation cohort, which is surprising since the majority of patients in the training set were transplanted for AML. Nevertheless, it is possible that ALL and AML require different models although no differences were detected in the training set. Disease-specific effects were analyzed extensively during the test development, but we were unable to construct separate plausible models for the two disease types due to insufficient numbers of samples. For future research in this direction, it seems mandatory to consider these two conditions separately, although an obvious issue is sample size limitations as inclusion criteria for the study become stricter.
In contrast with the primary classifier, which produced highly unstable results, the exploratory model exhibited directionally correct predictions, although it never approached statistical significance. This could perhaps be due to differences in class sizes (proportions of Preferred/NotPoor) between the two models. Future research should take this hypothesis into consideration.
Other statistical approaches can be used to create predictive algorithms. We also considered creating the predictive algorithm by using a survival model with L2 regularization19, such as Cox proportional hazards or a parametric survival model. In principle, the survival models can be used to directly estimate five-year survival probabilities of a given recipient for multiple potential donors. One could then rank the donors based on this statistic. We considered and evaluated this approach, but the resulting rankings were essentially random (data not shown). This could be due to dominance of discrete (clinical) variables, or other reasons. These alternate approaches were not considered further.
Emerging data such as whole-genome sequencing and genotyping microarrays may make future attempts at donor classifier models more successful since more genetic data will be available for modeling. We also hypothesize that these approaches might yield additional clinical improvements in terms of matching donors and recipients. Recent studies found unexpected associations between genome variation and a variety of phenotypes15, 20. Based on these results, it stands to reason that there may be additional areas of the human genome governing the immune system response to HCT. Whole genome analysis methods such as sequencing and genotyping appear to be natural frameworks for pursuing this concept.
Simultaneous with this research, a telomere-length-only model of outcomes of allogeneic HCT was pursued by the authors of this manuscript and others. Independent validation showed no association between the telomere length and overall survival21. Nevertheless, in the machine-learning model development, telomere length was a modest contributor to overall accuracy, perhaps due to interactions with other covariates. Consequently, it was retained in the final multivariate model.
In conclusion, using a machine-learning approach, we were not able to generate a predictive algorithm for survival after unrelated donor transplantation using the variables available in the CIBMTR database, even when supplemented with additional telomere length data generated specifically for this project. These results emphasize that validation studies are necessary to confirm provocative observations identified in risk prediction models. Planning for the validation study even before the training set is analyzed maximizes the chance of obtaining robust results that will ultimately move the field forward. Although we were disappointed by our final results, they do provide a definitive answer to our hypothesis.
Supplementary Material
Highlights.
Optimal unrelated donor selection has the potential to improve HCT success
We developed a multi-variable machine learning algorithm to improve donor selection
Despite promising preliminary results, the algorithm failed in pivotal study
Translating machine learning risk predictors to clinical use is a major challenge
Acknowledgments
The authors would like to thank Damjan Krstajic for helpful discussions and suggestions. This study was funded by Telomere Diagnostics.
The CIBMTR is supported primarily by Public Health Service Grant/Cooperative Agreement 5U24CA076518 from the National Cancer Institute (NCI), the National Heart, Lung and Blood Institute (NHLBI) and the National Institute of Allergy and Infectious Diseases (NIAID); a Grant/Cooperative Agreement 4U10HL069294 from NHLBI and NCI; a contract HHSH250201200016C with Health Resources and Services Administration (HRSA/DHHS); two Grants N00014-17-1-2388 and N00014-16-1-2020 from the Office of Naval Research; and grants from *Actinium Pharmaceuticals, Inc.; *Amgen, Inc.; *Amneal Biosciences; *Angiocrine Bioscience, Inc.; Anonymous donation to the Medical College of Wisconsin; Astellas Pharma US; Atara Biotherapeutics, Inc.; Be the Match Foundation; *bluebird bio, Inc.; *Bristol Myers Squibb Oncology; *Celgene Corporation; Cerus Corporation; *Chimerix, Inc.; Fred Hutchinson Cancer Research Center; Gamida Cell Ltd.; Gilead Sciences, Inc.; HistoGenetics, Inc.; Immucor; *Incyte Corporation; Janssen Scientific Affairs, LLC; *Jazz Pharmaceuticals, Inc.; Juno Therapeutics; Karyopharm Therapeutics, Inc.; Kite Pharma, Inc.; Medac, GmbH; MedImmune; The Medical College of Wisconsin; *Merck & Co, Inc.; *Mesoblast; MesoScale Diagnostics, Inc.; Millennium, the Takeda Oncology Co.; *Miltenyi Biotec, Inc.; National Marrow Donor Program; *Neovii Biotech NA, Inc.; Novartis Pharmaceuticals Corporation; Otsuka Pharmaceutical Co, Ltd. – Japan; PCORI; *Pfizer, Inc; *Pharmacyclics, LLC; PIRCHE AG; *Sanofi Genzyme; *Seattle Genetics; Shire; Spectrum Pharmaceuticals, Inc.; St. Baldrick’s Foundation; *Sunesis Pharmaceuticals, Inc.; Swedish Orphan Biovitrum, Inc.; Takeda Oncology; Telomere Diagnostics, Inc.; and University of Minnesota. The views expressed in this article do not reflect the official policy or position of the National Institute of Health, the Department of the Navy, the Department of Defense, Health Resources and Services Administration (HRSA) or any other agency of the U.S. Government.
*Corporate Members
Footnotes
Authorship Contributions
LB, JS, SRS, SJL, DL conceived and drafted the research plan; TW, LH, LF performed telomere analyses on samples; LB developed the machine learning models; LB, TW statistically analyzed the validation study results; SRS, SJL, LB, JS, TW interpreted results; LB, SRS, SJL drafted the paper; KF, KCH, MRV, MH critically reviewed the paper.
Disclosure of Conflicts of Interest
Jason Shelton is the CEO of Telomere Diagnostics, which funded this study. Todd Woodring is an employee of Telomere Diagnostics. Lyssa Friedman, Ljubomir Buturovic and Lyndal Hesterberg were consultants to Telomere Diagnostics during this project. All other authors declare no competing financial interests.
Publisher's Disclaimer: This is a PDF file of an unedited manuscript that has been accepted for publication. As a service to our customers we are providing this early version of the manuscript. The manuscript will undergo copyediting, typesetting, and review of the resulting proof before it is published in its final citable form. Please note that during the production process errors may be discovered which could affect the content, and all legal disclaimers that apply to the journal pertain.
References
- 1.Loftus D, Buturovic Lj, Tao W, et al. A predictive model using telomere length to select optimal donors for hematopoietic stem cell transplant (HCT) for acute leukemia. Blood. 2015;126:398. [Google Scholar]
- 2.Besse K, Maiers M, Confer D, Albrecht M. On Modeling Human Leukocyte Antigen-Identical Sibling Match Probability for Allogeneic Hematopoietic Cell Transplantation: Estimating the Need for an Unrelated Donor Source. Biol Blood Marrow Transplant. 2016 Mar;22(3):410–417. doi: 10.1016/j.bbmt.2015.09.012. [DOI] [PubMed] [Google Scholar]
- 3.Kollman C, Howe CWS, Anasetti C, et al. Donor characteristics as risk factors in recipients after transplantation of bone marrow from unrelated donors: the effect of donor age. Blood. 2001;98:2043–2051. doi: 10.1182/blood.v98.7.2043. [DOI] [PubMed] [Google Scholar]
- 4.Mancusi A, Ruggeri L, Urbani E, et al. Haploidentical hematopoietic transplantation from KIR ligand-mismatched donors with activating KIRs reduces nonrelapse mortality. Blood. 2015;125:3173–3182. doi: 10.1182/blood-2014-09-599993. [DOI] [PubMed] [Google Scholar]
- 5.Fleischhauer K, Bronwen ES, Gooley T, Malkki M, Bardy P, Bignon J-D, et al. Effect of T-cell-epitope matching at HLA-DPB1 in recipients of unrelated-donor haemopoietic-cell transplantation: a retrospective study. Lancet Oncoogy. 2012 Apr;13:366–374. doi: 10.1016/S1470-2045(12)70004-9. [DOI] [PMC free article] [PubMed] [Google Scholar]
- 6.Lee SJ, Klein J, Haagenson M, et al. High-resolution donor-recipient HLA matching contributes to the success of donor marrow transplantation. Blood. 2007;110:4576–4583. doi: 10.1182/blood-2007-06-097386. [DOI] [PubMed] [Google Scholar]
- 7.Pidala J, Lee SJ, Ahn KW, et al. Nonpermissive HLA-DBP1 mismatch increases mortality after myeloablative unrelated allogeneic hematopoietic cell transplantation. Blood. 2014;124(16):2596–606. doi: 10.1182/blood-2014-05-576041. [DOI] [PMC free article] [PubMed] [Google Scholar]
- 8.Bari R, Rujkijyanont P, Sullivan E, et al. Effect of donor KIR2DL1 allelic polymorphism on the outcome of pediatric allogeneic hematopoietic stem-cell transplantation. J Clin Oncol. 2013;31:3782–3790. doi: 10.1200/JCO.2012.47.4007. [DOI] [PMC free article] [PubMed] [Google Scholar]
- 9.Arora M, Lee SJ, Spellman SR, et al. Validation study failed to confirm an association between genetic variants in the base excision repair pathway and transplant-related mortality and relapse after hematopoietic cell transplantation. BBMT. 2016 doi: 10.1016/j.bbmt.2016.04.020. [DOI] [PMC free article] [PubMed] [Google Scholar]
- 10.Paik S, Shak S, Tang G, et al. A Multigene Assay to Predict Recurrence of Tamoxifen-Treated, Node-Negative Breast Cancer. N Engl J Med. 2004;351:2817–2826. doi: 10.1056/NEJMoa041588. [DOI] [PubMed] [Google Scholar]
- 11.Pham MX, Tuteberg JJ, Kfoury AG, et al. Gene-Expression Profiling for Rejection Surveillance after Cardiac Transplantation. N Engl J Medicine. 2010;362:1890–1900. doi: 10.1056/NEJMoa0912965. [DOI] [PubMed] [Google Scholar]
- 12.Handorf CR, Kulkarni A, Grenert JP, et al. A Multicenter Study Directly Comparing the Diagnostic Accuracy of Gene Expression Profiling and Immunohistochemistry for Primary Site Identification in Metastatic Tumors. Am J Surg Pathol. 2013 Jul;37:1067–1075. doi: 10.1097/PAS.0b013e31828309c4. [DOI] [PMC free article] [PubMed] [Google Scholar]
- 13.Alexander EK, Kennedy GC, Baloch ZW, et al. Preoperative Diagnosis of Benign Thyroid Nodules with Indeterminate Cytology. N Engl J Med. 2012;367:705–715. doi: 10.1056/NEJMoa1203208. [DOI] [PubMed] [Google Scholar]
- 14.Gadalla SM, Wang T, Haagenson M, et al. Association between donor leukocyte telomere length and survival after unrelated allogeneic hematopoietic cell transplantation for severe aplastic anemia. JAMA. 2015 doi: 10.1001/jama.2015.7. [DOI] [PMC free article] [PubMed] [Google Scholar]
- 15.Chahal HS, Wenting W, Ransohoff KJ, et al. Genome-wide association study identifies 14 novel alleles associated with basal cell carcinoma. Nature Communications. doi: 10.1038/ncomms12510. [DOI] [PMC free article] [PubMed] [Google Scholar]
- 16.Rode L, Nordestgaard BG, Bojesen SE. Long telomeres and cancer risk among 95568 individuals from the general population. Int J Epidemiol. 2016;45:1634–1643. doi: 10.1093/ije/dyw179. [DOI] [PubMed] [Google Scholar]
- 17.Svenson U, Nordfjall K, Stegmayr B, et al. Breast Cancer Survival Is Associated with Telomere Length in Peripheral Blood Cells. Cancer Res. 2008 May 15;68(10) doi: 10.1158/0008-5472.CAN-07-6497. [DOI] [PubMed] [Google Scholar]
- 18.Garg MB, Lincz LF, Adler K, et al. Predicting 5-fluoroacil toxicity in colorectal cancer patients from peripheral blood cell telomere length: a multivariate analysis. Br J Cancer. 2012;107:1525–1533. doi: 10.1038/bjc.2012.421. [DOI] [PMC free article] [PubMed] [Google Scholar]
- 19.Bovelstad HM, Nygard S, Storvold HL, et al. Predicting survival from microarray data – a comparative study. Bioinformatics. 2007;23(16):2080–2087. doi: 10.1093/bioinformatics/btm305. [DOI] [PubMed] [Google Scholar]
- 20.Manolio TA. Genomewide Association Studies and Assessment of the Risk of Disease. N Engl J Med. 2010;363:166–176. doi: 10.1056/NEJMra0905980. [DOI] [PubMed] [Google Scholar]
- 21.Gadalla SM, Wang T, Loftus D, et al. donor telomere length and outcomes after allogeneic unrelated hematopoietic cell transplant in patients with acute leukemia. ASH. 2016 doi: 10.1038/s41409-017-0029-9. [DOI] [PMC free article] [PubMed] [Google Scholar]
- 22.Cawthon RM. Telomere measurement by quantitative PCR. Nucleic Acids Res. 2002 May 15;30(10):e47. doi: 10.1093/nar/30.10.e47. [DOI] [PMC free article] [PubMed] [Google Scholar]
- 23.Cawthon RM. Telomere length measurement by a novel monochrome multiplex quantitative PCR method. Nucleic Acids Res. 2009 Feb;37(3):e21. doi: 10.1093/nar/gkn1027. [DOI] [PMC free article] [PubMed] [Google Scholar]
- 24.Lin J, Eppel E, Cheon J, et al. Analyses and comparisons of telomerase activity and telomere length in human T and B cells: insights for epidemiology of telomere maintenance. J Immunol Methods. 2010 Jan 31;352(1–2):71–80. doi: 10.1016/j.jim.2009.09.012. [DOI] [PMC free article] [PubMed] [Google Scholar]
- 25.Sanders JL, Newman A. Telomere Length in Epidemiology: A Biomarker of Aging, Age-Related Disease, Both, or Neither? Epidemiol Rev. 2013;35:1093. doi: 10.1093/epirev/mxs008. [DOI] [PMC free article] [PubMed] [Google Scholar]
- 26.Friedman J, Hastie T, Tibshirani R. Regularization Paths for Generalized Linear Models via Coordinate Descent. Journal of Statistical Software. 2010;33(1) [PMC free article] [PubMed] [Google Scholar]
- 27.Guyon I, Elisseeff A. An Introduction to Variable and Feature Selection. J Mach Learn Research. 2003;3:1157–1182. [Google Scholar]
- 28.Chang C-C, Lin C-J. LIBSVM: A Library for Support Vector Machines. ACM Trans Intell Syst Technol. 2011;2:3. Article 27. [Google Scholar]
- 29.Hastie T, Tibshirani R, Friedman J. The Elements of Statistical Learning. 2. Springer; 2008. [Google Scholar]
- 30.Bergstra D, Bengio Y. Random Search for Hyper-Parameter Optimization. J Mach Learn Research. 2012;13:281–305. [Google Scholar]
- 31.Krstajic D, Buturovic Lj, Leahy DE, Thomas S. Cross-validation pitfalls when selecting and assessing regression and classification models. J Cheminform. 2014 Mar 29;6:10. doi: 10.1186/1758-2946-6-10. [DOI] [PMC free article] [PubMed] [Google Scholar]
Associated Data
This section collects any data citations, data availability statements, or supplementary materials included in this article.


