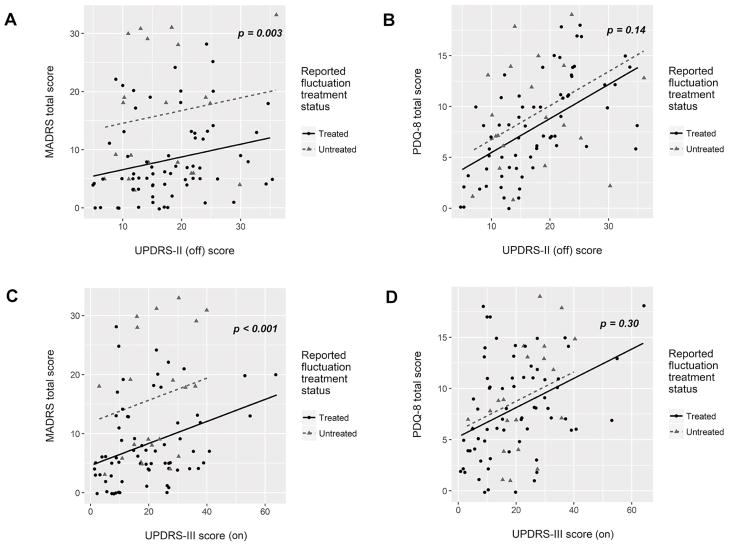
Figure 2. Perceived untreated fluctuations are associated with worse depression but not worse quality of life.
Depression score (A, C) or quality of life score (B, D) was linearly modeled based on either impairment in ADL (UPDRS-II, measured “off” medication) or neurologist-rated motor impairment (UPDRS-III, measured “on” medication). P-values derived from non-parametric analysis of covariance. All other scales of depression (HAM-D-17, IDS-C, and BDI) were also significantly higher in UF group (see supplemental table 2 for smoothing parameters and p-values for all depression scales).

