
Fig. 3.
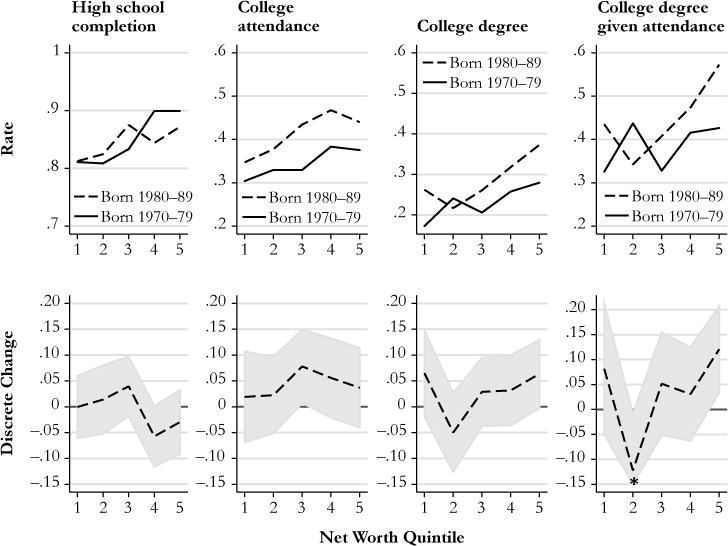
Cohort trends in controlled wealth gaps in education. Based on models including all control variables listed in Table 1, fully interacted by cohort. *Display of lower bound of one confidence interval (second quintile, college degree given college attendance) truncated to maintain the same y-axis scale across outcomes