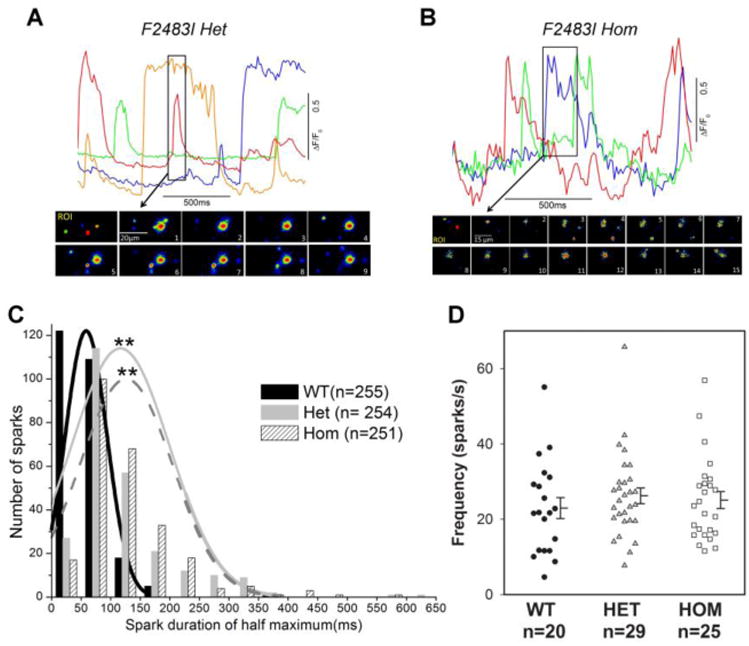
Figure 3. Calcium sparks in F2483I-RyR2 hiPSC-CMs.

(A and B top panels) The time courses of normalized Ca2+-dependent fluorescence intensity at the selected color-coded regions in) F2483I heterozygous and homozygous cells. (A and B bottom panels) Image sequences at the selected time in the top panels (boxed parts) show evolutions of long-lasting Ca2+ sparks. (C) Histogram of spark durations in wild type and F2483I mutant cells and the fitted curves were generated by ORIGIN8 (Northampton, MA). Averaged spark durations are 58 ± 2 msec (n=255), 117 ± 5 msec ** (n=254), and 126 ± 5 msec ** (n=251) for wild type, heterozygous, and homozygous cells, respectively. ** p<0.001 compared with wild type by one-way ANOVA followed by Tukey's test. (D) Spark frequency measured in the three genotype cells showed no significant differences. Data are shown as dot plots with mean ± SEM.
