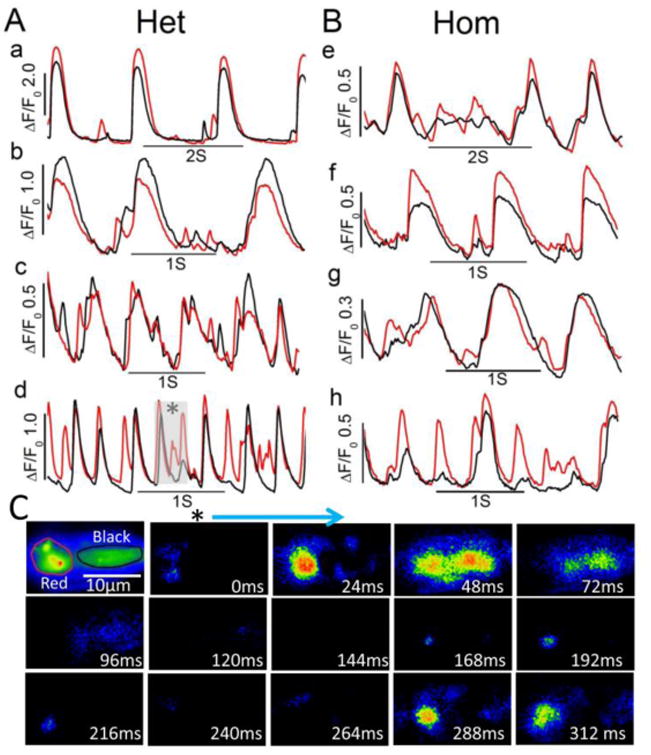
Figure 4. Aberrant local Ca2+ releases occurring interspersed in between spontaneously active Ca2+-transients in heterozygote and homozygote hiPSC-CMs.

(A and B) time courses of normalized Ca2+-dependent fluorescence intensity at the two regions (red and black in panel C) in four F2483I heterozygous (a-d) and four homozygous (e-h) hiPSC-CMs showing additional Ca2+ release events between the rhythmic Ca2+ releases. (C) Representative image sequences at the selected time in trace d (gray highlighted) showing the evolution of spontaneous beat and aberrant Ca2+ releases. The first panel shows average fluorescence distributions and examples of red and black regions.
