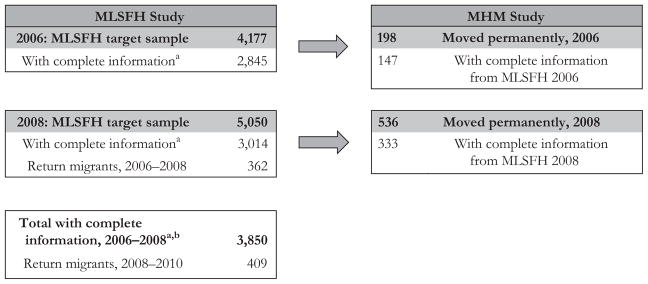
Fig. 1.
MLSFH and MHM Study sample flow chart. aComplete information: includes data for measures used in the analysis and an HIV test result. Those without complete information were (1) not interviewed or tested for HIV by MLSFH, (2) interviewed but not tested for HIV, or (3) tested for HIV but not interviewed. Detailed flow charts and information on each of these categories and analyses of attrition and nonresponse are available in Kohler et al. (2015) (for MLSFH) and Anglewicz et al. (2017) (MHM). bOf the 3,850 with complete information, 2,009 were interviewed in both 2006 and 2008; 836 were interviewed only in 2006; and 1,005 were interviewed only in 2008

