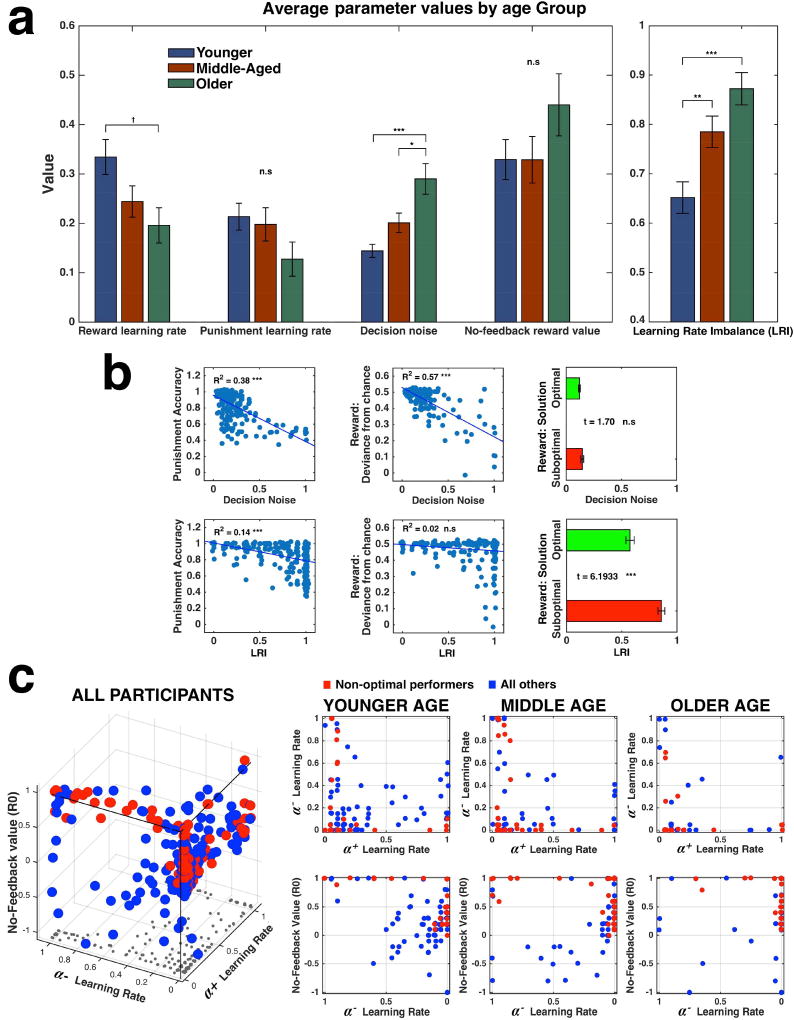
Fig. 3.
Analysis of fitted parameters (for 250 participants). (a) Left, average values of the four parameters fit to the model, by age group. Right, average Learning Rate Imbalance measure, by age group. * - p < 0.02; ** - p < 0.008; *** - p < 0.0001; † - trend; n.s - not significant. Error bars illustrate standard errors of the means. (b) Correlations of behavioral performance meaasures with Decision Noise (top row) and Learning Rate Imbalance (bottom row) across all participants. Small amount of gaussian noise (SD = 0.01) was added to the scatter plots’ datapoints to improve visualisation. *** - p < 0.0001; n.s - not significant. (c) Left, 3D Scatter of three individually-fit parameters: α+, α− and R0, for all participants in the study. Each dot represents one participant. Projection of each dot on the X–Y plane is marked by a small grey dot to allow easier understanding of the 3D scatter. Right, 2D projections of the 3D scatter plot, on two different planes, separately for each age group. Red: Participants that learned a non-optimal solution for at least one of the positive-feedback stimuli (‘Non-optimal performers’). Blue: rest of participants. Small amount of gaussian noise (SD=0.01) was added to the datapoints to improve visualisation.

