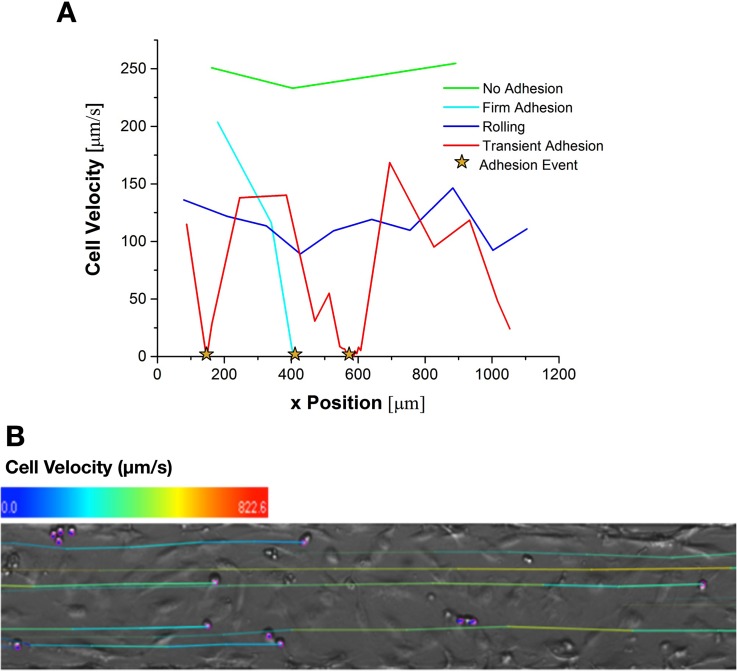
FIG. 2.
Illustration of states of dynamic adhesion using velocity versus position profiles for the four states of adhesion. (a) The data shown were gathered from individual cells clearly exhibiting each behavior during adhesion assays with a mean velocity of 300 μm/s. Adhesion events are defined as periods where the cell becomes immobilized for at least one frame sequence. (b) A representative image after cell tracking analysis. The color of the track indicates the cell's velocity history.

