Fig. 7.
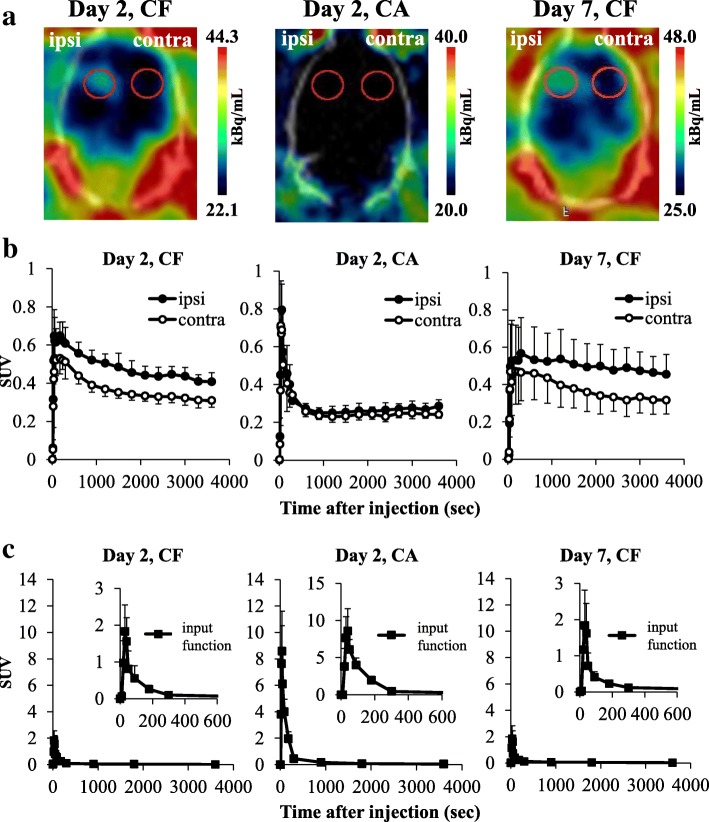
Typical [18F]DPA-714 PET images and time activity curves in the striatum. a Typical horizontal summed PET images of 20–60-min scans at days 2 and 7 after 20-min middle cerebral artery occlusion (MCAO). The left side of each image is the ipsilateral side. These images including the VOIs (red circles) show screen captures from PMOD. b The time activity curves of the VOI placed on the ipsilateral or the contralateral striatum of 20-min MCAO rats injected with [18F]DPA-714 at day 2 (CF: n = 5) and day 7 (CF: n = 4) or [18F]DPA-714 following unlabeled (R, S)-PK11195 (3 mg/kg) at day 2 (CA: n = 5). c Metabolite-corrected plasma radioactivity (input function) of 20-min MCAO rats injected with [18F]DPA-714 at day 2 (CF, n = 5) and day 7 (CF: n = 4) or [18F]DPA-714 following unlabeled (R, S)-PK11195 (3 mg/kg) at day 2 (CA: n = 5). Graphs show SUV, with values expressed as mean ± SD. *CF: A group of rats was injected [18F]DPA-714 only. **CA: A group of rats was injected [18F]DPA-714 and an excess of unlabeled (R, S)-PK11195

