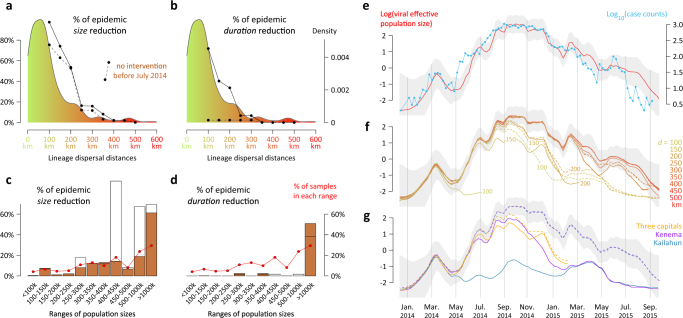
Fig. 1.
Hypothetical impact of intervention strategies. a, b Reductions in epidemic size and duration following the prevention of dispersal over a range of distances between administrative areas. These quantities are summarised as the percentages by which phylogenetic tree length and height are reduced when the phylogeny is pruned at all the branches that accommodate such dispersal events (full lines). The dashed lines represent the corresponding reductions when the dispersal events are prevented only after June 2014. These curves are superimposed on the distribution of lineage dispersal distances summarised from the posterior Markov jump history (coloured from green to red). c, d Reductions in epidemic size and duration following the prevention of dispersal to administrative areas belonging to a specific population sizes range. These percentage reductions are also obtained by pruning the phylogeny, but now at all branches that accommodate dispersal events to the relevant administrative areas (white histogram bars). The brown histogram bars represent the corresponding reductions when the dispersal events are prevented only after June 2014. We refer to Supplementary Fig. 1 for credible intervals associated with percentages of epidemic size/duration reductions reported in Fig. 1a–d. All the reductions in tree length and height were computed by conditioning the pruning on movement events recorded in the MCC (maximum clade credibility) tree summary of the discrete phylogeographic reconstruction. Supplementary Fig. 2 summarises the equivalent results for pruning trees using the Markov jump histories associated with each posterior tree. e Estimates of viral population size (in red; 95% HPD in grey) and the time series of case counts (in blue). f Impact of preventing long-distance dispersal events on viral effective population size through time. As in Fig. 1e, the 95% HPD of viral population size based on the entire dataset (no intervention strategy) is displayed in grey. On this graph, dashed lines correspond to viral population size evolution when transmission is prevented only after June 2014. g This plot corresponds to Fig. 1f but focuses on the impact of preventing dispersal events to specific locations on viral effective population size through time

