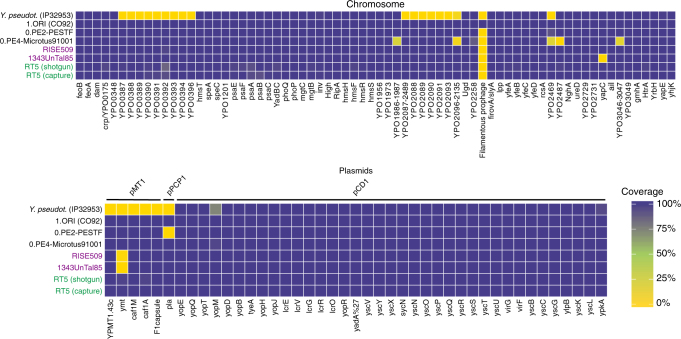
Fig. 3.
Heat map of coverage across virulence-associated genes. The virulence potential of RT5 shotgun-sequenced and captured genomes is compared to representative strains from the LNBA lineage, namely, RISE509 (whose virulence profile is identical to that of isolates RK1.001, GEN72, Gyvakarai1 and Kunila23) and 1343UnTal85 (whose virulence profile is identical to 6Postillionstrasse and RISE5053). In addition it is compared to modern-isolate representatives 0.PE4-Microtus91001, 0.PE2-PestoidesF and 1.OR1-CO92, and to Y. pseudotuberculosis (strain IP32953). The virulence factors inspected were located on the Y. pestis chromosome, as well as on the pMT1, pPCP1 and pCD1 plasmids. The percentage of each gene covered (scale bar) was computed and plotted in the form of a heatmap using the ggplot279 package in R

