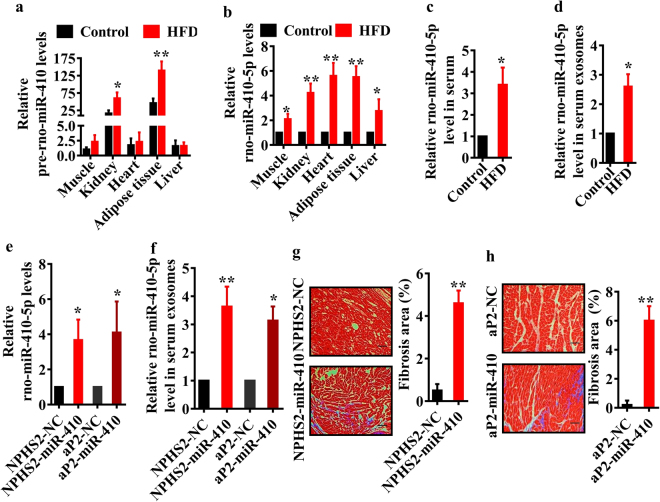
Figure 7.
miR-410-5p from the kidney and adipose tissues promotes cardiac fibrosis. (a) The levels of pre-miR-410 (a) and miR-410-5p (b) were determined by qPCR in different tissues of rats fed normal diet and HFD, respectively. All results are standardized to the levels of 18S rRNA and the means ± SD of three experiments (n = 10 in each experiment). *P < 0.05; **P < 0.01 relative to control (normal group). (c,d) The levels of miR-410-5p in serum (c) and exosomes (d) of rats fed normal diet and HFD. These results are the means ± SD of three experiments (n = 10 in each experiment). *P < 0.05 relative to control. (e) The levels of miR-410-5p in the heart of rats fed normal diet with kidney- or adipocyte-specific overexpression of miR-410. NPHS2-miR-410, kidney-specific overexpression; aP2-miR-410, adipocyte-specific overexpression. *P < 0.05 relative to negative control (NC). All results are standardized to the levels of 18S rRNA and the means ± SD of three experiments (n = 10 in each experiment). (f) The levels of miR-410-5p in exosomes of rats fed normal diet with kidney- or adipocyte-specific overexpression of miR-410. These results are the means ± SD of three experiments (n = 10 in each experiment). *P < 0.05; **P < 0.01 relative to NC. (g,h) Masson’s staining of heart in rats (Left panels). Quantitative analysis of fibrotic area (Right panel). These results are means ± SD of three experiments (n = 10 in each experiment). **P < 0.01 relative to NC. Scale bar, 20 μm.

