Figure 2.
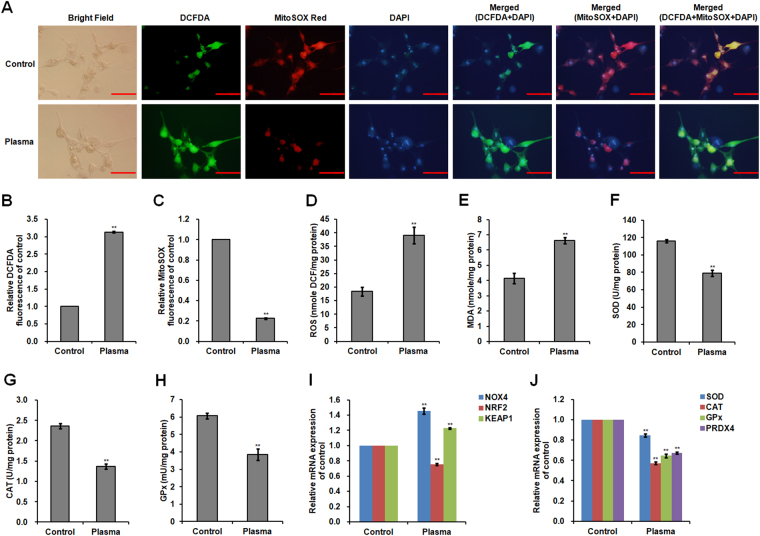
ROS production and antioxidant activity of plasma-treated SCs. Chicken SCs were exposed to 22.0 kV of non-thermal plasma for 120 s. (A) Imaging of SCs stained with DCFDA/MitoSOX Red/DAPI. Intracellular ROS production was detected by DCFDA staining and mitochondrial superoxide was detected by MitoSOX Red staining. DCFDA: green fluorescence; MitoSOX Red: red fluorescence; DAPI: blue fluorescence. Scale bar: 50 μm. (B) Relative fluorescence intensity for DCFDA staining. (C) Relative fluorescence intensity for MitoSOX Red staining. (D) Total ROS levels in SCs. (E) MDA level in SCs. Activities of (F) SOD, (G) CAT, and (H) GPx in SCs. Relative mRNA levels of (I) NOX4, NRF2, and KEAP1, and (J) SOD, CAT, GPx, and PRDX4. Data are represented as the mean ± SD (n = 3 per group). *p < 0.05; **p < 0.01, according to one-way ANOVA and LSD test.

