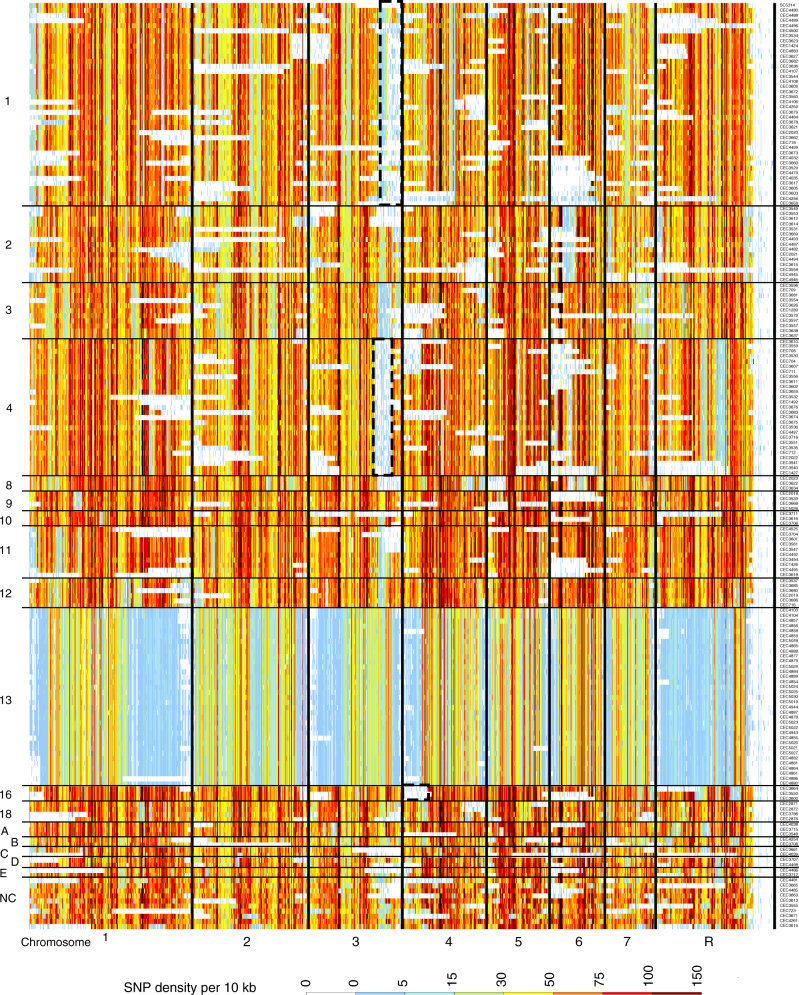
Fig. 1.
Density of heterozygous SNPs in 182 C. albicans isolates, in 10 kb windows. Each row represents a strain. Strains are ordered according to their cluster assignation. Thick vertical black lines delimit chromosomes (from 1 to 7 and R). Dotted black boxes highlight examples of ancestral LOH shared by all isolates of a cluster. Horizontal white stripes are indicative of recent LOH events. The scale bar represents density of heterozygous SNPs per 10 kb window, from a low density in light blue (white for 0) to a high density in dark red

