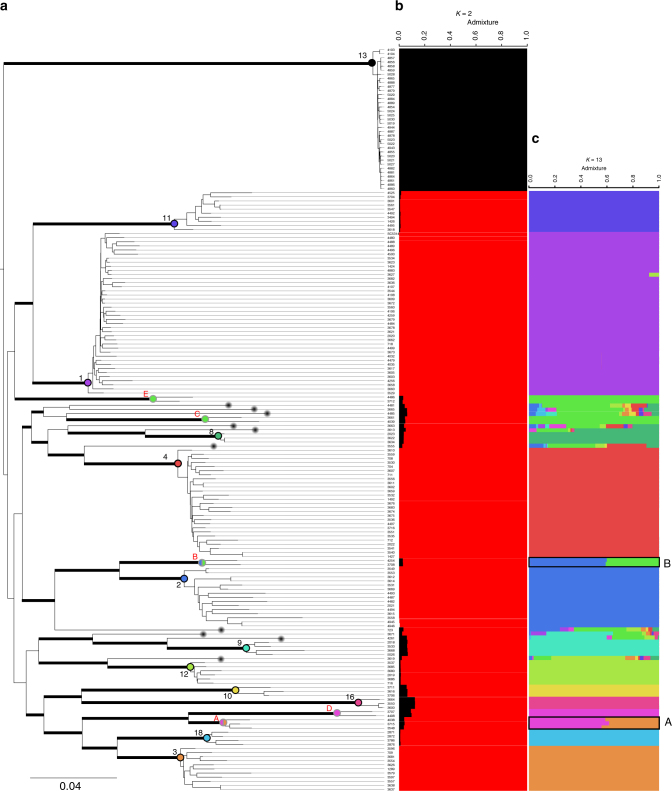
Fig. 2.
Phylogenetic relationships and population structure of Candida albicans. a Maximum likelihood tree showing phylogenetic relationships between the 182 isolates used in this study; Thick bars represent bootstrap supports >95% (bootstrap analysis of 1000 resampled datasets); branch lengths are shown and the scale bar represents 0.04 substitutions per site. We used the midpoint rooting method to root the tree. Clusters already described in previous studies using MLST data are written in black (from 1 to 18, incomplete due to sampling) and new clusters described in this study are written in red and named with letters from A to E. Black dots at the end of some branches (10 in total) pinpoint strains which could not be assigned to any cluster. b, c Population structure of C. albicans at b K = 2 and c K = 13. The structure has been inferred using NgsAdmix. Each line represents a strain, as in the ML tree (a) and colored bars represent their coefficients of membership in the various gene pools based on SNP data

