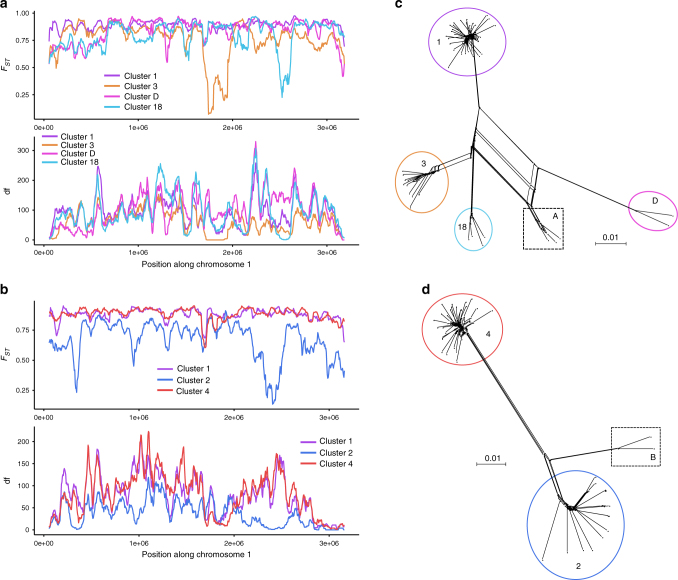
Fig. 4.
Evidence of admixture in clusters A and B. a and b Genomic scans of FST (fixation index, an index measuring the differentiation between populations) and df (the number of fixed differences between populations) in sliding windows of 50 kb using a window step of 5000 bp. Predicted regions of admixture correspond to those that show a drop in both FST and df. a Comparison of cluster A to clusters 1, 3, D and 18 along chromosome 1; b comparison of cluster B to cluster 1 and 2 along chromosome 1; c, d neighbor-net analyses based on SNP data including c clusters A, 3, D, 18 and 1 and d clusters 2, B and 1; branch lengths are shown in c and d and the scale bar represents 0.01 substitutions per site

