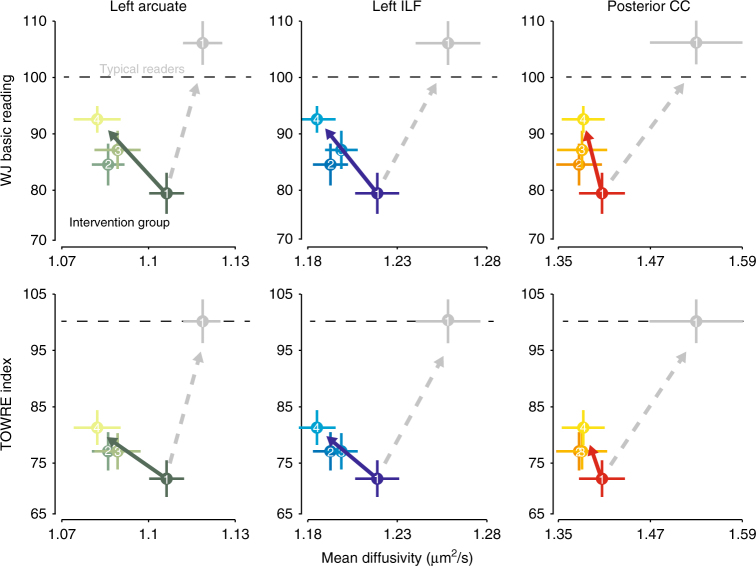
Fig. 3.
Reading intervention does not normalize differences in the white matter. Reading skill is plotted as a function of mean diffusivity for each session (1–4) for the left arcuate, ILF, and posterior callosal tracts in the intervention group. The gray circle and lines in each panel show the mean and standard error at Session 1 for the subset non-intervention control subjects with reading skills in the typical range (poor reading controls were excluded, leaving n = 10 typical reading controls). The dashed gray arrow shows the expected trajectory for MD values if the intervention group were to become more similar to the typical reading controls in terms of both reading skills and MD. In contrast, the true trajectory of change in plotted as a colored arrow in each panel. The intervention group includes some readers with only moderate reading impairments (and, therefore, higher MD values), and so the group difference in pre-intervention scores is less than would be expected for a group of good vs. poor readers. Supplementary Fig. 7 reproduces the intervention data alongside the same mean and SE plots for the full sample of control subjects during sessions 1–3, to further illustrate the relative stability of both white matter and behavior in the control group

