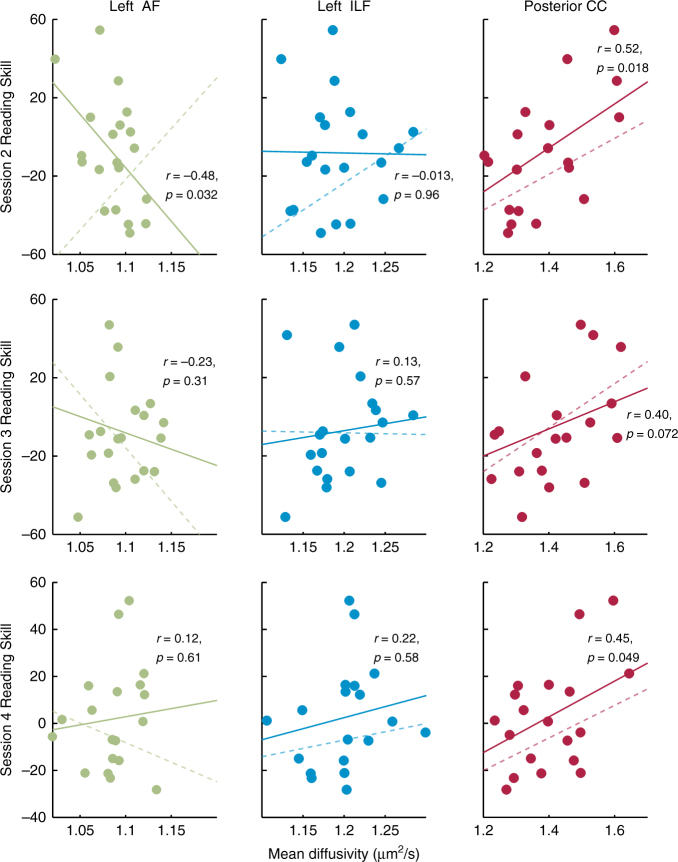
Fig. 4.
Correlations between white matter properties and reading skill change during learning. Plots show the cross-sectional correlation for sessions 2–4 (top to bottom) for each tract for the intervention group. A solid best-fit line is plotted for each session. A dashed line in each panel represents the best-fit line for the preceding session (session n−1) to illustrate the session-to-session changes. For the AF and ILF, correlations change in size and/or direction, demonstrating that anatomy–behavior relationships can depend on recent educational experience

