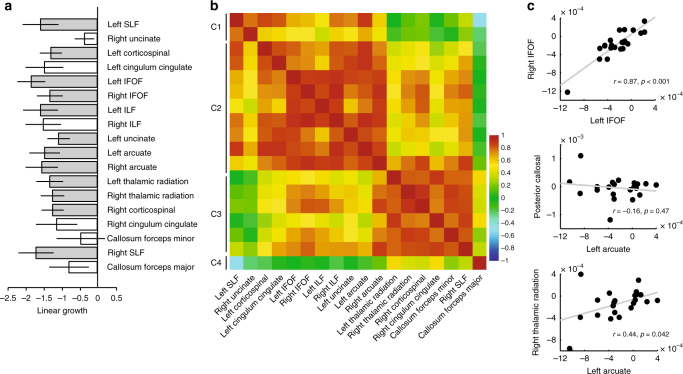
Fig. 6.
Reading intervention causes distributed changes in the white matter. a Change in MD as a function of intervention time (in hours) for 18 tracts. Tracts showing significant change (Bonferroni-corrected p < 0.05) are indicated as gray filled bars. Error bars depict standard errors from a linear mixed effects model. b Hierarchical clustering based on the correlations between linear growth rates. The heat map represents Pearson correlations between linear growth rates for pairs of tracts across individuals. The matrix is sorted according to hierarchical clustering of these correlation coefficients. c Scatter plots of individual growth rates for three pairs of tracts: left vs. right IFOF, AF vs. CC, and AF vs. right thalamic radiation

