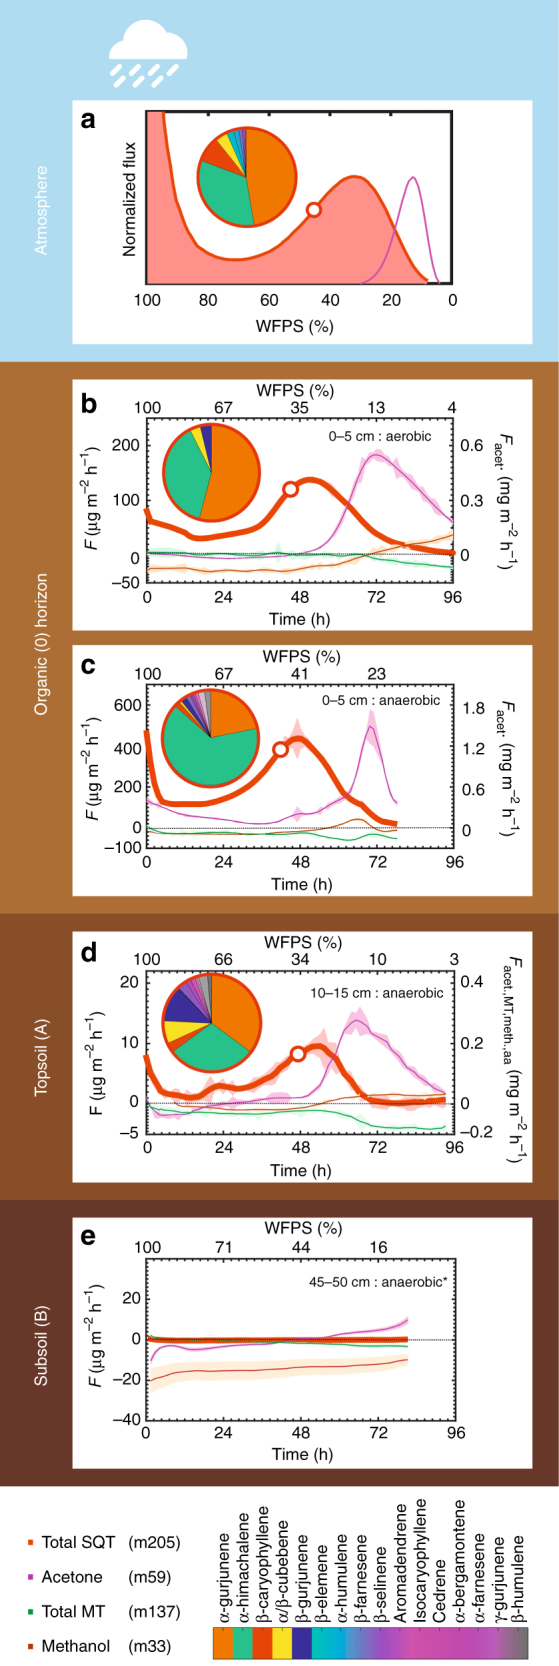
Fig. 1.

Vertical profile of VOC fluxes from a Terra Firme soil (TF1). a Normalized soil fluxes of sesquiterpenes (SQTs) (red) and acetone (purple) as a function of water-filled pore space (WFPS). The normalized (to the optimum emission observed at moderate moisture) algorithm-derived emission curve is the result of integrating laboratory observations from b organic horizon under aerobic and c anaerobic conditions, d topsoil (10–15 cm) and e subsoil (45–50 cm). SQTs, monoterpenes (MTs), acetone, and methanol are illustrated with the colored lines. Acetone, methanol, and α-pinene were included in the fumigation standard (see Methods). The shaded areas indicate the standard deviation of the measured emission rates at each chamber cycle. The pie charts illustrate the chemical speciation of SQT at the point in time (and WFPS), indicated by the white circle over the SQT measurements (red line). For the color scale, see lower right panel. The pie chart at a illustrates the chemical composition under field conditions. The asterisk in e denotes that the experiments were performed under aerobic conditions despite the predominant anaerobic conditions in the deep soil layers
