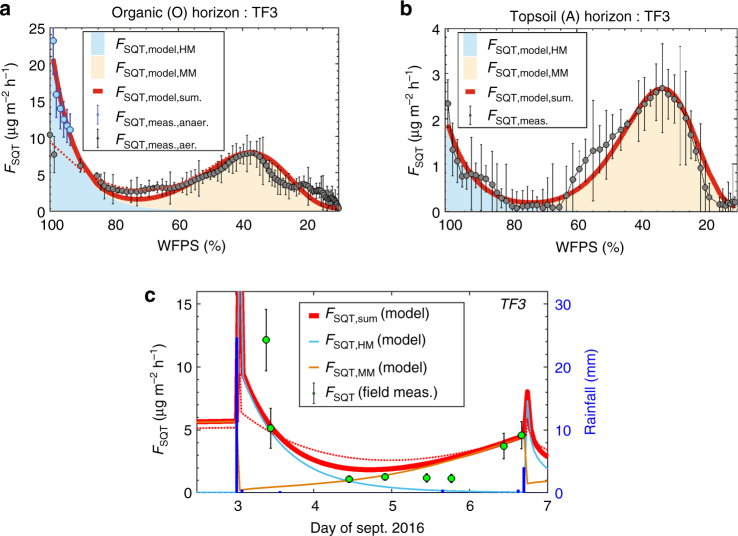
Fig. 5.
Emission model over laboratory and field conditions. a, b SQT emissions from Amazonian soils are a function of two processes: an emission burst that occurs after a strong rain event and high moisture (HM; cyan area) and continual microbial emissions that occur at optimum soil moisture conditions over the moderate moisture range (MM; beige area). For the (O) horizon (a, c), a rain event may (red line as model output) or may not (red dashed line as model output) activate anaerobic response, so both laboratory experiments (blue points for anaerobic/gray points for aerobic; error bars indicate the standard (N = 4) of the measurements) were simulated by the model. In c, FSQT,sum was calculated by assuming anaerobic activation down to 90% WFPS and that both (O) and (A) horizons (Fig. 3a, b) contribute to the release of SQT. The green bullets and bars in c indicate the means and standard of the field measurements

