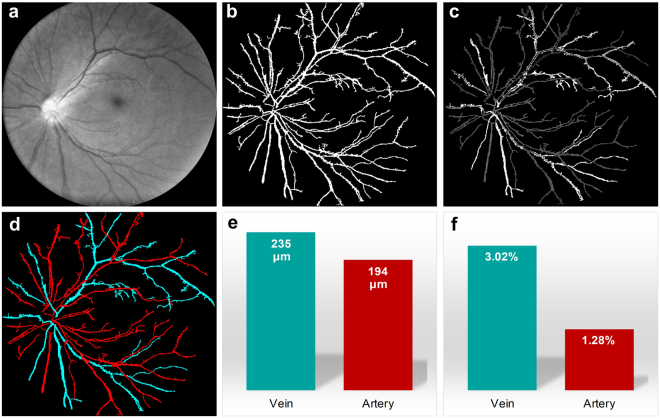
Figure 2.
Automated arteries and veins classification of the wide field fundus image shown in Fig. 1b2. (a) The green channel of the fundus image in Fig. 1b2. Same image as Fig. 1d2 with brightness increased for better visualization. (b) Segmented blood vessel map using the green channel. (c) Optical density ratio map of red and green channels. (d) Arteries (red) and veins (cyan) classified by automated algorithm. (e) Average artery and vein diameters. (f) Average artery and vein tortuosity.

