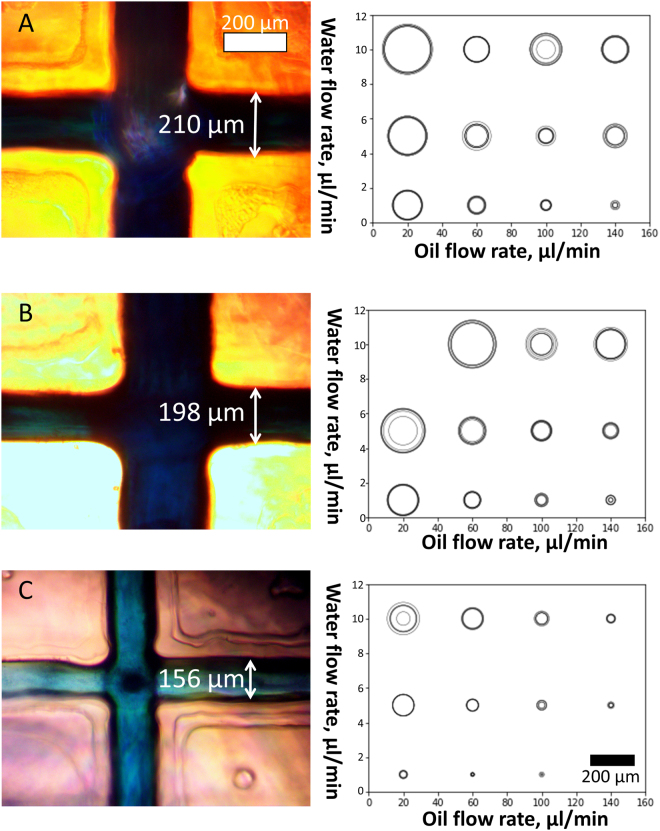
Figure 3.
Effect of flow rate and channel size on droplet size. Droplet generator channels are shown at left. Scatter plots at right show the effect of oil and water flow rate on droplet diameter. A 200 µm scale bar is shown in the bottom right. The size of the outlet channel in which droplets were generated was (A) 210 μm, (B) 298 μm, and (C) 156 μm at the base of the triangular channel profile. Flow rate combinations that produced oscillating droplet diameters are represented as concentric circles in the scatter plot, with circle size proportional to the range of droplet sizes produced.

