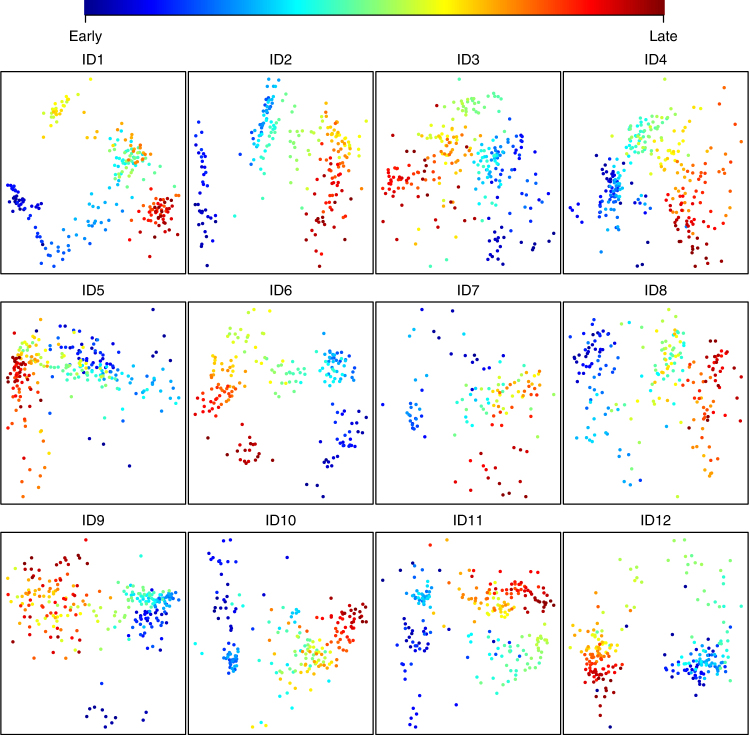
Fig. 1.
Development of the infant GI microbiota is highly structured in time. Each panel shows a non-metric multidimensional scaling (nMDS) plot based on Bray–Curtis distances, for each of the 12 infants. For each model there is a highly significant relationship between the primary axis of variation and time since birth (for all tests p ≪ 0.001, mean R2 = 0.7 (range 0.47–0.86), linear regression). Dots are colored according to the bar above the panels. Early and late refer to the order in which the samples were collected (see Table 1 for days of first and last sampling)

