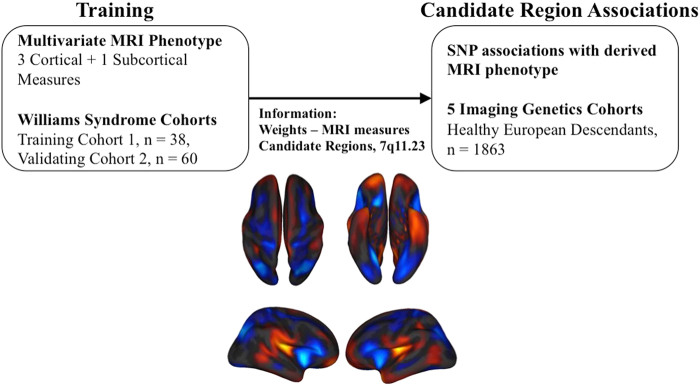
Fig. 1. Flow chart of the study design.
The first stage of the analysis (Training) was deriving neuroanatomical scores based on case-control data, using a methodology which has been published elsewhere24. The second stage of the analysis (Candidate Region Associations) is the focus of this paper, wherein we directly apply the neuroanatomical scores from large-scale imaging genetic cohorts without further calibration of the model parameters

