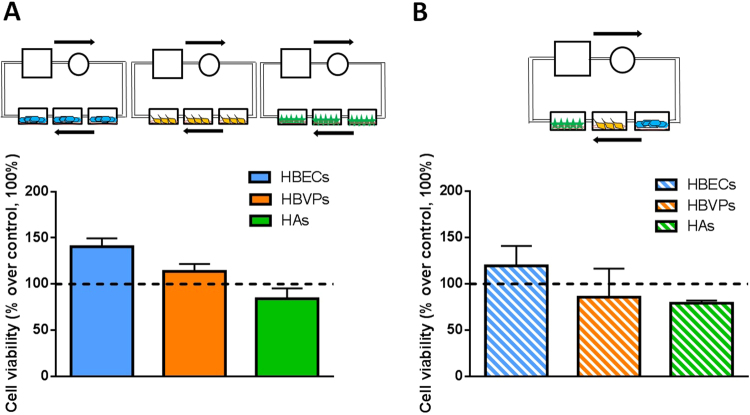
Figure 4.
Cell viability measured by MTT assay comparing the three cell types under flow (50 µl/min) individually and in triplicate after 72 h inside the QV500 chambers (A) and the three cell types under flow (50 µl/min) together (one replicate of each cell time per experiment) (B). Results in both cases were normalized using the static conditions-control (black dotted line, 100%) from 3 to 8 independent experiments. No significant differences were observed.

