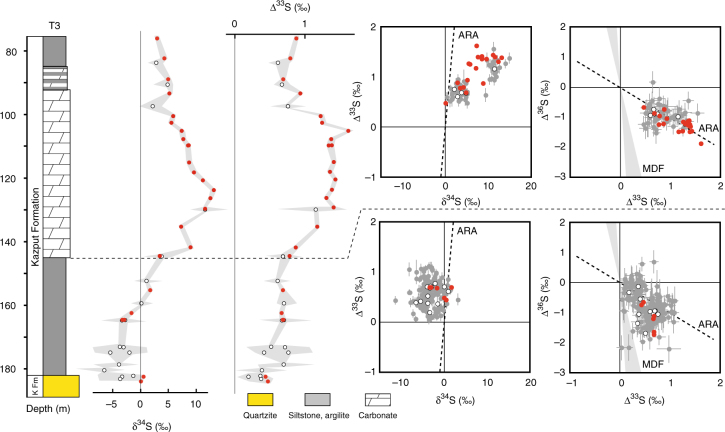
Fig. 4.
δ34S and Δ33S profiles of sulphides in drill core T3 and associated δ34S-Δ33S and Δ33S-Δ36S compositional diagrams. Red dots, bulk analysis; white dots, mean value of in situ analysis for each sample; grey dots, individual spot analysis using the SHRIMP-SI (error bars are standard deviation of 1σ, see Methods). The grey shaded areas in the δ34S and Δ33S profiles represent the range of individual spot analysis for each sample. ARA, Archaean Reference Array, MDF, mass-dependent fractionation of sulphur isotopes, KFm, quartzite of the Koolbye Formation. The stratigraphic column below 145 m depth corresponds to the domain (ii) discussed in the text and shown in Fig. 2

