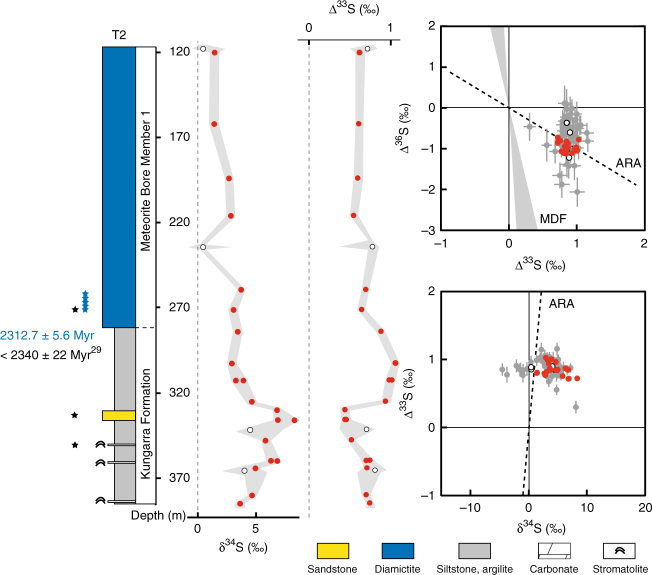
Fig. 5.
δ34S and Δ33S profiles of sulphides in drill core T2 and associated δ34S-Δ33S and Δ33S-Δ36S compositional diagrams. Red dots, bulk analysis; white dots, mean value of in situ analysis for each sample; grey dots, individual point analysis using the SHRIMP-SI (error bars are standard deviation of 1σ, see Methods). The grey shaded areas in the δ34S and Δ33S profiles represent the range of individual point analysis for each sample. ARA, Archaean Reference Array, MDF, mass-dependent fractionation of sulphur isotopes. Sulphide Re-Os date of 2312.7 ± 5.6 Ma is from this study. Zircon U-Pb date of 2340 ± 22 Ma is from Caquineau et al.29. The black and blue stars adjacent to the lithologic column correspond to the samples used for Re-Os (blue) and U-Pb (black) dating

