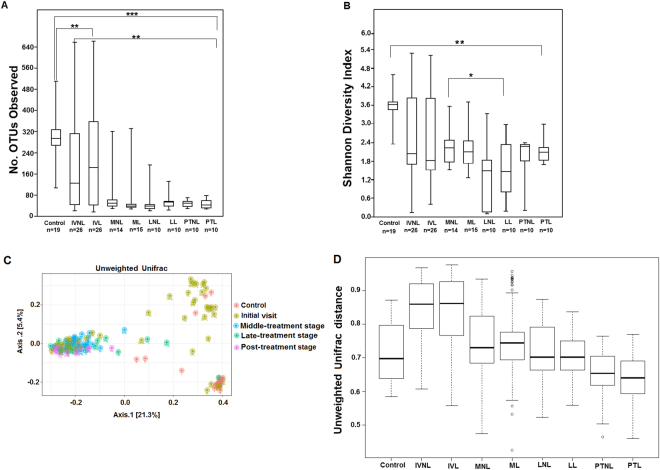
Figure 1.
Alpha and beta diversity indices of the skin microbiome from control and patient groups. (A) A boxplot of the number of observed OTUs. (B) Boxplot based on Shannon diversity index. (C) Principal coordinate analysis of unweighted UniFrac, representing the distance between the skin bacterial communities from the control and patient groups. (D) Unweighted UniFrac distance boxplots showing differences between the control and patient groups and within patients longitudinally. For all the boxplots, the centerlines indicate the median, with the lower and upper edges of each box representing the first and third quartiles, respectively. The outliers are displayed as dots. Patient groups are named for the initial visit (IV), middle-treatment stage (M), late-treatment stage (L) and post-treatment (PT); and they are non-lesional (NL) and lesional (L). The P values were calculated by Wilcoxon rank sum test (*p < 0.05 **p < 0.01 and *** p < 0.0001), and adjusted by Bonferroni correction.

