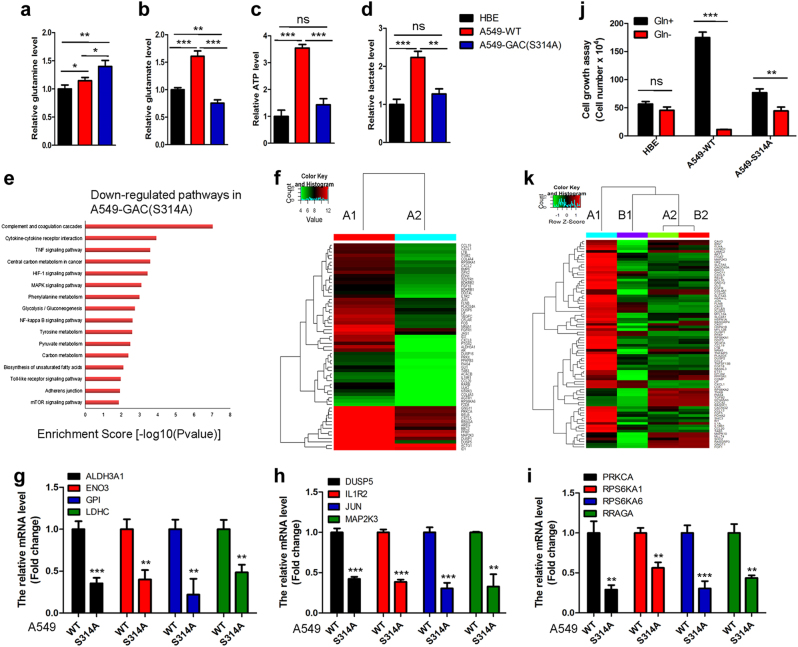
Fig. 7.
Inhibition of glutamine metabolism induces metabolic reprogramming and reverses transformed phenotypes. a–d HBE, A549-WT, and A549-GAC (S314A) cells were cultured and metabolites including glutamine (a), glutamate (b), ATP (c), and lactate (d) were determined by kits. *P < 0.05, **P < 0.01, ***/P < 0.001, ns: P > 0.05. e Signaling pathways downregulated in A549-GAC (S314A) cells compared with parental A549 cells are shown. f Heat map of Agilent whole human genome oligo microarray data demonstrates differences in gene expression profiles between parental A549 cells (A1) and A549-GAC (S314A) cells (A2). g–i Genes participating in glycolysis (g), MAPK signaling (h), and mTOR signaling (i) were analyzed by q-PCR. Data represent the average of three independent experiments (mean ± SD). **P < 0.01, ***P < 0.001. j Cell growth assay. HBE cells were cultured in Airway epithelial cell basal medium in the presence or absence of glutamine for 6 days; parental A549 and A549-GAC(S314A) cells were cultured in RPMI 1640 containing 10% FBS in the presence or absence of glutamine for 6 days, then cells were trypsinized and counted. Data represent the average of three independent experiments (mean ± SD). **P < 0.01, ***P < 0.001, ns: P > 0.05. k Heat map of Agilent whole human genome oligo microarray data, which demonstrated the differences in gene expression profiles among A549 cells cultured in glutamine added medium (A1), in glutamine free medium (B1); A549-GAC(S314A) cells cultured in glutamine added medium (A2) and in glutamine free medium (B2)

