Figure 1.
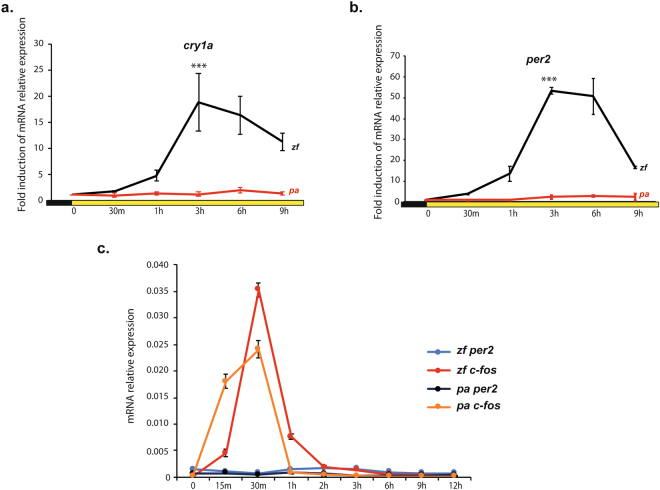
Loss of light induced clock gene expression in P. andruzzii CF1 cells. qPCR analysis of cry1a (a) and per2 (b) from zebrafish (PAC-2) (zf, black traces) and P. andruzzii (CF1) (pa, red traces) cell lines. Samples were taken at different time points during 9 hours exposure to light (tungsten light source, 20 μW/cm2). Mean fold induction of mRNA relative expression with respect to time 0 (n = 3) ± SD is plotted on the y-axes, whereas time is plotted on the x-axes. Levels of significance between peak points of expression and time 0 are indicated for each gene (***p < 0.001, **p < 0.01, *p < 0.05). Black and yellow bars below the graphics indicate the different lighting conditions during the experiment. Statistical analysis was performed by one-way ANOVA followed by Bonferroni multiple comparison test. (c) qPCR analysis of per2 and c-fos mRNA expression from zebrafish (zf) and P. andruzzii (pa) cell lines. Samples were taken at different time points during a 12 hours period following a serum shock. mRNA relative expression with respect to time 0 (n = 3) ± SD is plotted on the y-axis, while time (minutes (m) or hours (h)) is plotted on the x-axis.

