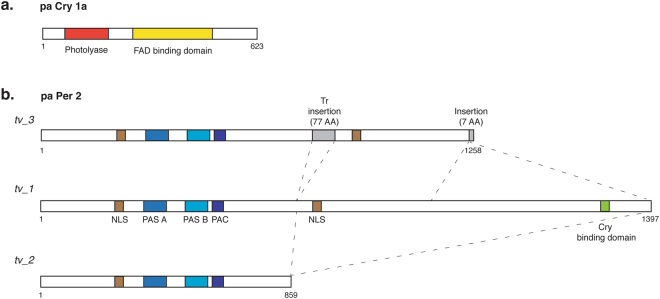
Figure 2.
Schematic representation of the predicted proteins encoded by the single pa cry1a and three pa per2 cavefish transcripts. In the case of pa Cry1a (a), the red bar represents the Photolyase domain while the yellow bar indicates the extent of the Flavin Adenine Dinucleotide (FAD) binding domain. In the three transcript variants of pa Per2 (b), (tv_1, tv_2 and tv_3), brown bars represent nuclear localization signals (NLS), blue bars, the Per, Arnt, Sim (PAS) A domain, light blue bars, the PAS B domain and violet bars, the PAC domain (motif C-terminal to the PAS domains). The green bar shows the position of the Cry interaction domain (absent from isoforms pa Per2_tv2 and pa Per2_tv3), while the grey bar shows the location of the transposon-derived (Tr) and intronic sequences in pa Per2_tv3. Dotted lines indicate the location of amino acid sequences in pa Per2_tv2 and pa Per2_tv3 relative to pa Per2_tv1. Numbers below each protein schematic representation indicate the corresponding amino acid positions.

