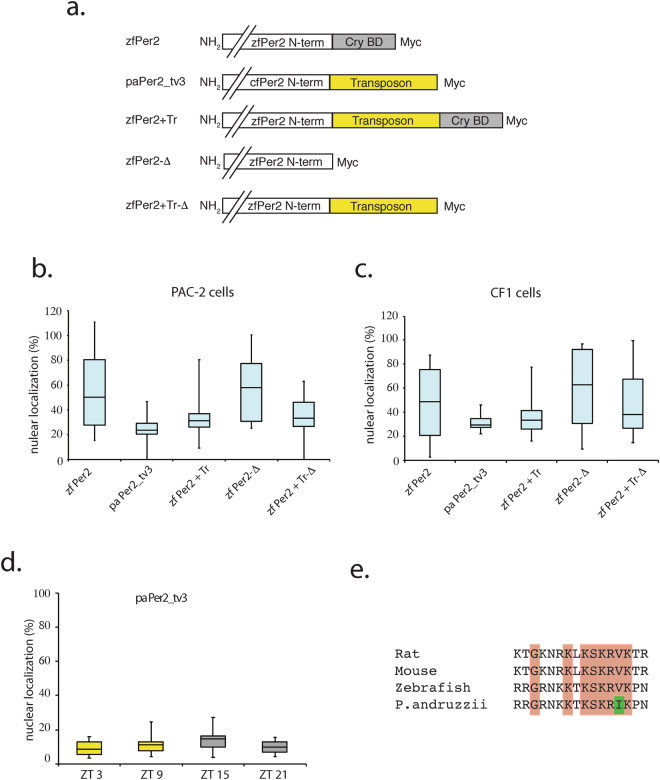
Figure 4.
Subcellular localization of Per2 proteins in cavefish and zebrafish. (a) Schematic representation of Myc tagged expression constructs for the wild type zebrafish per2 (zfPer2) and the more abundant cavefish (paPer2_tv3) form. Also, all the alternative engineered versions of zfPer2 mimicking the cavefish mutations are depicted. zfPer2+Tr incorporates the cavefish transposon intron-derived sequence, zfPer2-Δ carries a deletion of the Cry binding domain (Cry BD) and zfPer2+Tr-Δ incorporates both modifications present in the P. andruzzii Per2_tv3 protein. (b,c) Box-and-whisker plot diagrams representing the subcellular distribution of the various Per2 expression constructs transfected in (b) PAC-2 and (c) CF1 cells. Nuclear localization in % is plotted on the y-axes, while the names of the Per2 constructs are indicated on the x-axes. The whiskers (lines extending vertically from the boxes) represent the variability outside the upper and lower quartiles. The length of the boxes indicates the degree of dispersion in the data. The horizontal line within the boxes indicates the median. (d) Box-and-whisker plot diagrams representing the daily subcellular distribution of the cavefish pa Per2_tv3 construct transfected in zebrafish PAC-2 cells exposed to an LD cycle. Nuclear localization in % is plotted on the y-axis, while ZT times are indicated on the x-axis. All statistical analysis were performed by Kruskal-Wallis test followed by Dunn’s Multiple Comparison Test. (e) Amino acid sequence alignment of the bipartite nuclear localization sequence34 in the Per2 proteins of rat, mouse, zebrafish and P. andruzzii. Orange boxes highlight conserved amino acids while the green box represents the substituted amino acid in the cavefish protein with respect to the other 3 vertebrate species.

