Fig. 7.
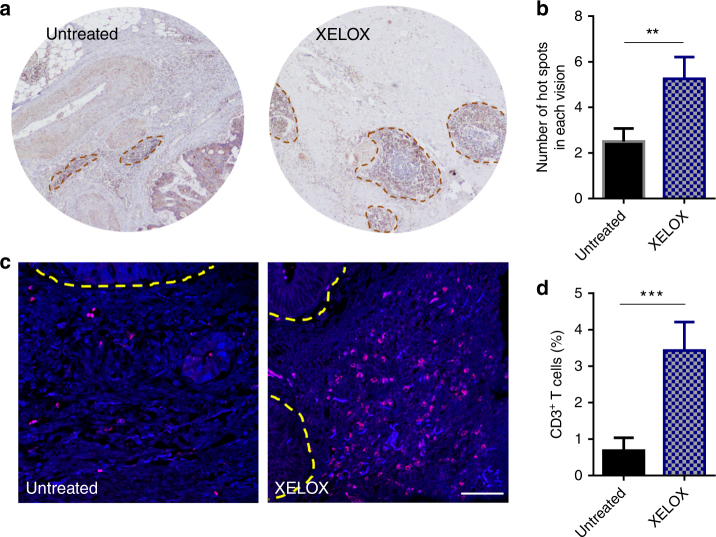
MSS colorectal cancer patient sample analysis. a Representative immunohistochemistry images of tumor tissues from MSS colorectal cancer patients. Untreated represents samples from patients without any therapy. XELOX represents samples from patients after XELOX neoadjuvant chemotherapy. Images are taken at ×40 magnification. Dark red circles indicate the hot spots in each visual field. b Statistics of hot spots in each visual field (n = 4 samples per group). c Representative immunofluorescence images of tumor tissues using DAPI (blue) and anti-CD3 (red). Yellow dotted line indicates the border between intestinal mucosa and the tumor. Scale bar represents 50 μm. d Statistics of CD3+ T cell ratios in each slice (n = 5 samples per group). Significant differences were assessed in b and d using t test. Results are presented as mean (SD). **P < 0.01, ***P < 0.001

