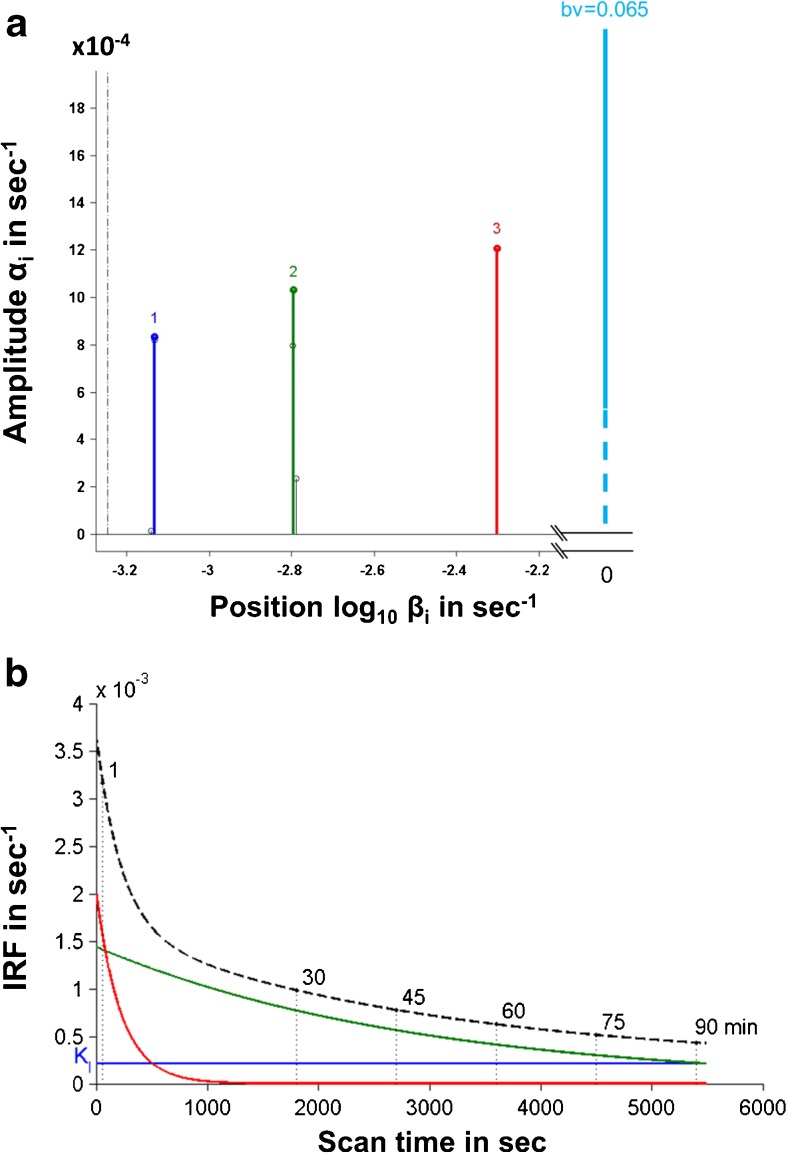
Fig. 1.
a Kinetic spectrum for a healthy control subject, which revealed three different components [at position βi of 7.07e-04 s-1 (blue), 1.58e-03 s-1 (green) and 5.01e-03 s-1 (red) with amplitude αi of 8.35e-04 s-1, 1.03e-03 s-1, and 1.21e-03 s-1] with fractional blood volume (bv) of 0.065 (cyan). b Predicted curves using spectral analysis IRF (impulse response function) for tracer activity (dashed line) which was measured by the sum of three individual components of the spectrum. The blue (KI), green and red curves corresponded to the three component peaks in the spectrum

