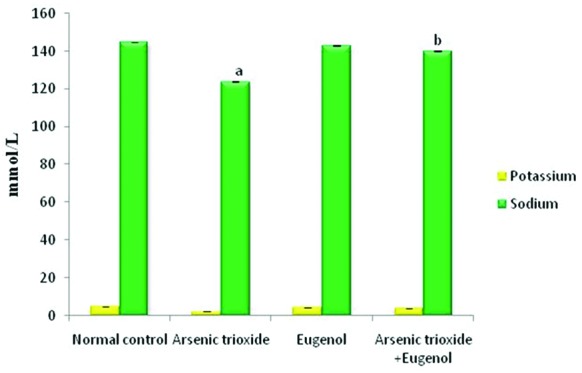
Figure3.

Effects of eugenol on tissue potassium and sodium levels in the liver. Here the experimental group comprises normal control, arsenic trioxide (4 mg/kg bwt), eugenol (5 mg/kg bwt), and arsenic trioxide (4 mg/kg bwt)+eugenol (5 mg/kg bwt). Data are presented as mean±SD and n=6. ‘a’ represents a significant difference between the normal control group and the arsenic trioxide group (P<0.001 for potassium and P=0.01 for sodium). ‘b’ indicates a significant difference between the arsenic trioxide and the arsenic trioxide+eugenol (P=0.03 for potassium and P<0.001 for sodium).
