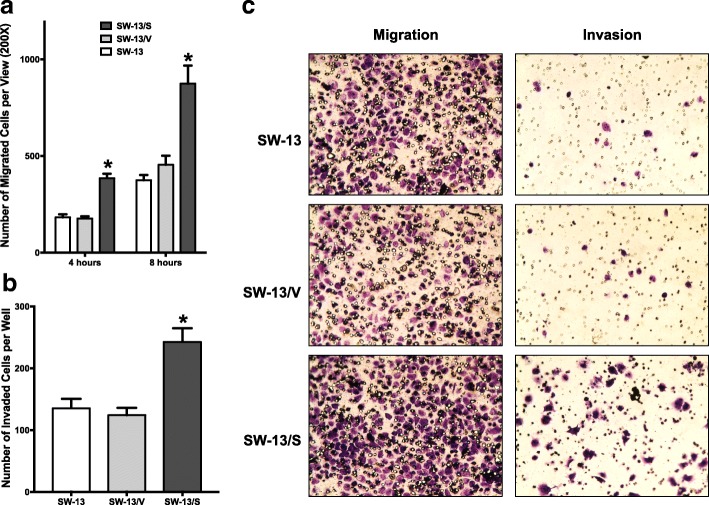
Fig. 3.
SW-13 Migration and invasion analysis. a For 4 and 8 h, 100,000 cells per well of SW-13, SW-13/V, and SW-13/S were allowed to migrate through a modified Boyden chamber. Increased migration rates at both time points were in observed in SW-13/S cells (*, p < 0.05, two-way ANOVA). Horizontal bar, mean; Error bars, standard error of mean. Migration assays were performed in two independent experiments using 3 wells per each cell type analyzed. b One hundred thousand cells of SW-13, SW-13/V, and SW-13/S were allowed to invade through a Matrigel layer in a modified Boyden chamber. Increased invasion activity was noted in SW-13/S cells (*, p < 0.05, one-way ANOVA). Horizontal bar, mean; Error bars, standard error of mean. Invasion assays were performed in two independent experiments using 3 wells per each cell type analyzed. c Representative photomicrographs of migrating and invading SW-13/S cells with controls are shown

