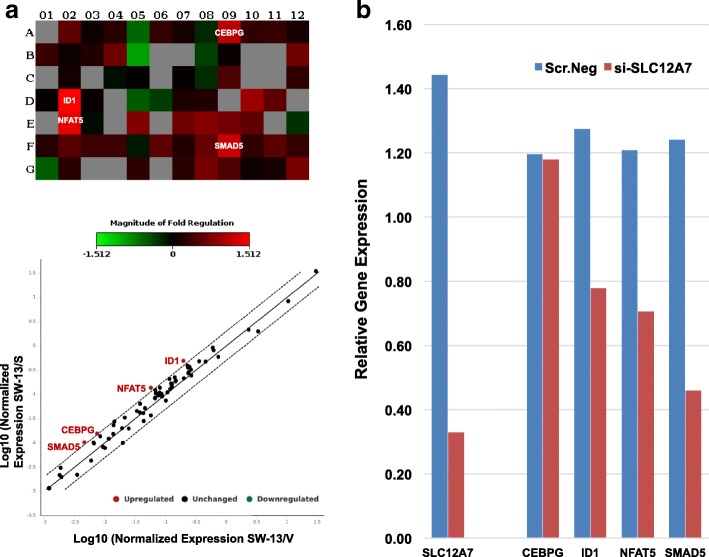
Fig. 8.
Transcription factor expression analysis. a To assess possible altered transcriptional activation downstream to SLC12A7 enforced expression, transcription factor expression analysis was performed using the RT2 Profile PCR Human Transcription Factors array. The four transcription factors that appeared to be significantly (p = 0.05) overexpressed is noted in the heatmap (above) and the Log10 expression is shown in the scatter plot (below). Note, none of the targeted transcription factors showed a significant down-regulation in SW-13/S cells. Transcription factor expression analysis was performed in duplicate. b To confirm the significance of altered transcription factor signaling identified in SW-13/S cells, altered transcription factor expression was measured using quantitative PCR techniques (refer above) in NCI-H295R cells undergoing siRNA knock down. Expressions levels of ID1, NFAT5, and SMAD5 were suppressed, while expression of CEBPG was not significantly altered. Transcription factor expression analysis was performed in duplicate

