Fig. 2.
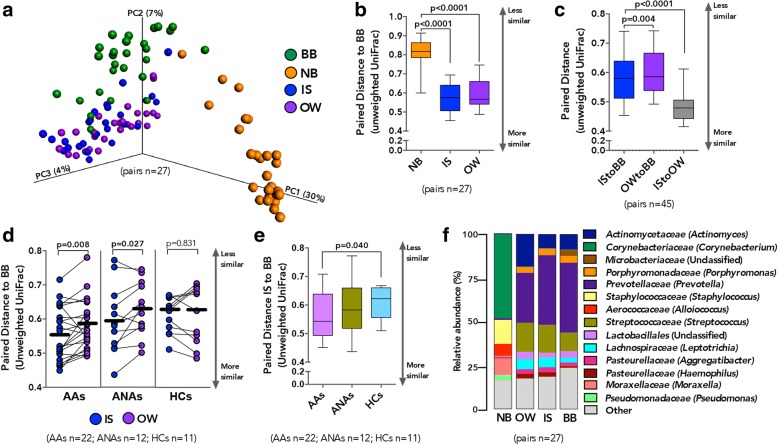
Compositionally lower airway microbiota is more similar to the oral than nasal cavity. a Principal coordinate analysis (unweighted UniFrac) shows compositional dissimilarity between paired samples (linear mixed-effects model, p < 0.0001). b Mean intra-subject paired distance to BB shows that the NB microbiota are most distinct from BB (Wilcoxon matched-pairs signed rank test; Whiskers extend to 95% confidence interval). c Shorter mean intra-subject paired distance between IS and BB compared to OW and BB, suggests that the IS microbiota are more representative of BB than OW is of BB (Wilcoxon matched-pairs signed rank test; Whiskers extend to 95% confidence interval). d Shorter mean intra-subject paired distance is observed between BB and IS compared to OW in AAs and ANAs but not HCs (Paired t test). e Shorter mean intra-subject paired distance between IS and BB in AAs compared to HCs (Welch’s corrected t test; Whiskers extend to 95% confidence interval) suggests that IS microbiota are more representative of BB in asthmatic subjects. f Summary of the relative abundance of taxa identified in paired samples (n = 27) shows NB as being the most compositionally distinct. Bacterial taxonomic classification is shown at a family (genus) level

