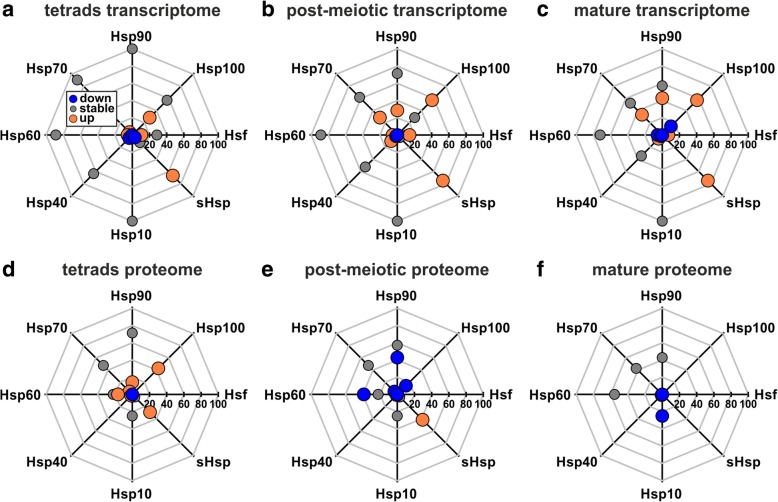
Fig. 6.
Regulation of Hsp and Hsf families upon HS at transcript and protein level. Shown is the percentage of Hsp and Hsf family proteins detected in tetrads (a and d), post-meiotic (b and e) and mature pollen (c and f) at transcript (upper row) and protein level (lower row). Proteins of the different families are subdivided with respect to their regulation upon HS with either downregulation (blue), stable levels (grey) or upregulation (orange)

