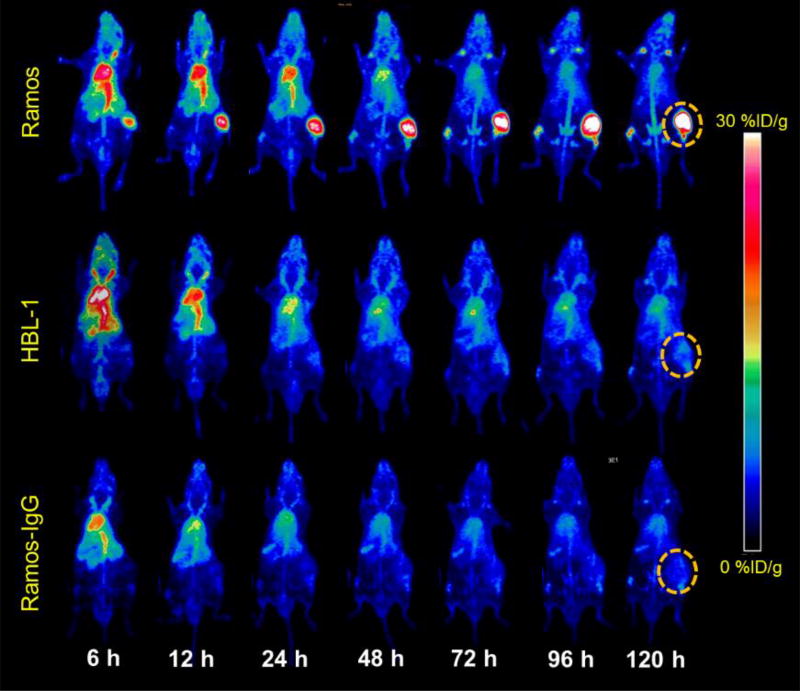
Figure 2.
PET maximum intensity projection (MIP) images of Ramos and HBL-1 lymphoma tumor bearing models from 6 to 120 h post-injection. Following injection of 89Zr-Df-daratumumab, Ramos tumors displayed higher uptake than HBL-1 tumors at all time points. After injection of a 89Zr-Df-IgG, Ramos tumors demonstrated significantly decreased uptake at the same time points. Tumors are indicated by dashed circles.

